
| Name: FAM156A | Sequence: fasta or formatted (213aa) | NCBI GI: 31543441 | |
|
Description: family with sequence similarity 156, member A
| Not currently referenced in the text | ||
|
Composition:
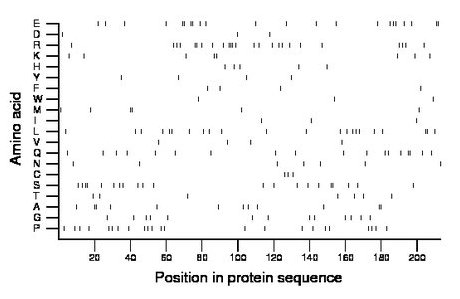
Amino acid Percentage Count Longest homopolymer A alanine 5.6 12 2 C cysteine 1.4 3 1 D aspartate 1.4 3 1 E glutamate 10.3 22 2 F phenylalanine 1.9 4 1 G glycine 6.1 13 1 H histidine 2.3 5 1 I isoleucine 1.4 3 1 K lysine 3.8 8 2 L leucine 10.3 22 2 M methionine 2.8 6 2 N asparagine 3.3 7 1 P proline 10.8 23 1 Q glutamine 8.5 18 2 R arginine 11.7 25 3 S serine 9.9 21 2 T threonine 3.3 7 1 V valine 1.9 4 1 W tryptophan 1.4 3 1 Y tyrosine 1.9 4 1 |
Comparative genomics:
Search single species RefSeq proteins at NCBI
Search summary 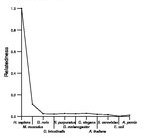
Figure data | ||
Related human proteins:Protein Relative score Description Self-match 1.000 family with sequence similarity 156, member A FAM156B 1.000 family with sequence similarity 156, member B [Homo... LOC100127919 0.048 PREDICTED: similar to stella LOC100127919 0.048 PREDICTED: similar to stella LOC100127919 0.048 PREDICTED: similar to developmental pluripotency-as... DPPA3 0.041 stella LOC100131102 0.036 PREDICTED: hypothetical protein LOC100131102 0.036 PREDICTED: hypothetical protein CCDC102A 0.034 coiled-coil domain containing 102A ANKRD24 0.029 ankyrin repeat domain 24 LOC644794 0.029 PREDICTED: hypothetical protein LOC644794 0.029 PREDICTED: hypothetical protein LOC644794 0.029 PREDICTED: hypothetical protein LOC644794 0.029 PREDICTED: hypothetical protein EIF5B 0.027 eukaryotic translation initiation factor 5B ARMC5 0.027 armadillo repeat containing 5 isoform b MAP7D1 0.027 MAP7 domain containing 1 NFATC4 0.024 nuclear factor of activated T-cells, cytoplasmic, c... NFATC4 0.024 nuclear factor of activated T-cells, cytoplasmic, ca... LOC100293644 0.024 PREDICTED: hypothetical protein LOC100287563 0.024 PREDICTED: hypothetical protein LOC100287563 0.024 PREDICTED: hypothetical protein XP_002343733 ZNF541 0.024 zinc finger protein 541 AAK1 0.024 AP2 associated kinase 1 LOC100130982 0.024 PREDICTED: hypothetical protein LOC100130982 0.024 PREDICTED: hypothetical protein LOC100130982 0.024 PREDICTED: hypothetical protein BAI1 0.022 brain-specific angiogenesis inhibitor 1 precursor [... KIAA1949 0.022 phostensin KIAA1949 0.022 phostensinHuman BLASTP results (used to prepare the table) | |||
Gene descriptions are from NCBI RefSeq. Search results were obtained with NCBI BLAST and RefSeq entries. When identical proteins are present, the self-match may not be listed first in BLASTP output. In such cases, the table above has been reordered to place it first.
See About the Figures for the scoring system used in the figure above right. The same scoring system was used in the table of BLASTP results.
Guide to the Human Genome
Copyright © 2010 by Stewart Scherer. All rights reserved.
