
| Name: TFAP2B | Sequence: fasta or formatted (460aa) | NCBI GI: 118582289 | |
|
Description: transcription factor AP-2 beta
|
Referenced in: Additional Genes in Development
| ||
|
Composition:
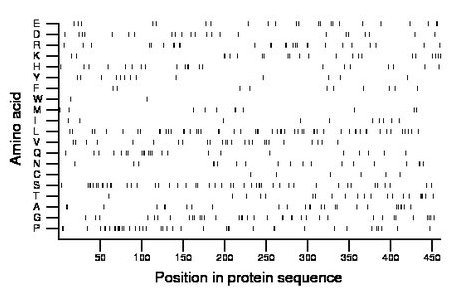
Amino acid Percentage Count Longest homopolymer A alanine 5.7 26 2 C cysteine 1.3 6 1 D aspartate 5.0 23 1 E glutamate 5.0 23 2 F phenylalanine 2.2 10 1 G glycine 8.0 37 2 H histidine 4.6 21 2 I isoleucine 2.2 10 1 K lysine 4.8 22 2 L leucine 11.7 54 2 M methionine 2.4 11 2 N asparagine 4.1 19 2 P proline 8.7 40 3 Q glutamine 5.0 23 2 R arginine 5.9 27 2 S serine 10.2 47 2 T threonine 4.6 21 3 V valine 5.4 25 1 W tryptophan 0.4 2 1 Y tyrosine 2.8 13 1 |
Comparative genomics:
Search single species RefSeq proteins at NCBI
Search summary 
Figure data | ||
Related human proteins:Protein Relative score Description Self-match 1.000 transcription factor AP-2 beta TFAP2A 0.642 transcription factor AP-2 alpha isoform a TFAP2A 0.620 transcription factor AP-2 alpha isoform c TFAP2A 0.619 transcription factor AP-2 alpha isoform b TFAP2E 0.521 transcription factor AP-2 epsilon (activating enhan... TFAP2C 0.503 transcription factor AP-2 gamma TFAP2D 0.361 transcription factor AP-2 beta-like 1 ARID1A 0.024 AT rich interactive domain 1A isoform a ARID1A 0.024 AT rich interactive domain 1A isoform b RBM33 0.014 RNA binding motif protein 33 ZNF462 0.012 zinc finger protein 462 MED12 0.012 mediator complex subunit 12 RERE 0.011 atrophin-1 like protein isoform b RERE 0.011 atrophin-1 like protein isoform a RERE 0.011 atrophin-1 like protein isoform a BAI1 0.011 brain-specific angiogenesis inhibitor 1 precursor [... IQSEC1 0.011 IQ motif and Sec7 domain 1 isoform a GRINA 0.011 glutamate receptor, ionotropic, N-methyl D-aspartate... GRINA 0.011 glutamate receptor, ionotropic, N-methyl D-aspartate... ATXN2 0.010 ataxin 2 ANXA11 0.010 annexin A11 ANXA11 0.010 annexin A11 ANXA11 0.010 annexin A11 RELL2 0.010 RELT-like 2 RELL2 0.010 RELT-like 2 PTPN21 0.010 protein tyrosine phosphatase, non-receptor type 21 ... WNK4 0.010 WNK lysine deficient protein kinase 4 SCAF1 0.010 SR-related CTD-associated factor 1 PRSS12 0.010 neurotrypsin precursor DMRTB1 0.010 DMRT-like family B with proline-rich C-terminal, 1 [...Human BLASTP results (used to prepare the table) | |||
Gene descriptions are from NCBI RefSeq. Search results were obtained with NCBI BLAST and RefSeq entries. When identical proteins are present, the self-match may not be listed first in BLASTP output. In such cases, the table above has been reordered to place it first.
See About the Figures for the scoring system used in the figure above right. The same scoring system was used in the table of BLASTP results.
Guide to the Human Genome
Copyright © 2010 by Stewart Scherer. All rights reserved.
