
| Name: PTGR1 | Sequence: fasta or formatted (329aa) | NCBI GI: 226059133 | |
|
Description: prostaglandin reductase 1 isoform 1
|
Referenced in: Arachidonate, Prostaglandins, and Leukotrienes
| ||
Other entries for this name:
alt prot [301aa] prostaglandin reductase 1 isoform 2 alt mRNA [329aa] prostaglandin reductase 1 isoform 1 | |||
|
Composition:
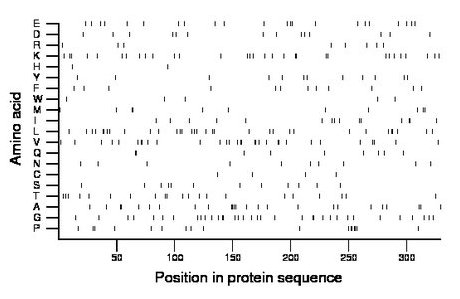
Amino acid Percentage Count Longest homopolymer A alanine 7.6 25 3 C cysteine 1.2 4 1 D aspartate 4.3 14 1 E glutamate 6.7 22 2 F phenylalanine 3.6 12 1 G glycine 10.6 35 2 H histidine 0.6 2 1 I isoleucine 4.6 15 2 K lysine 9.4 31 2 L leucine 10.0 33 2 M methionine 3.3 11 2 N asparagine 3.0 10 1 P proline 5.2 17 3 Q glutamine 2.7 9 2 R arginine 2.4 8 1 S serine 3.6 12 1 T threonine 6.4 21 2 V valine 9.4 31 2 W tryptophan 1.5 5 1 Y tyrosine 3.6 12 1 |
Comparative genomics:
Search single species RefSeq proteins at NCBI
Search summary 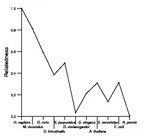
Figure data | ||
Related human proteins:Protein Relative score Description Self-match 1.000 prostaglandin reductase 1 isoform 1 PTGR1 1.000 prostaglandin reductase 1 isoform 1 PTGR1 0.890 prostaglandin reductase 1 isoform 2 PTGR2 0.279 prostaglandin reductase 2 PTGR2 0.279 prostaglandin reductase 2 PTGR2 0.279 prostaglandin reductase 2 ZADH2 0.118 zinc binding alcohol dehydrogenase domain containing... CRYZ 0.067 crystallin, zeta isoform a CRYZ 0.067 crystallin, zeta isoform a TP53I3 0.055 tumor protein p53 inducible protein 3 TP53I3 0.055 tumor protein p53 inducible protein 3 CRYZ 0.055 crystallin, zeta isoform b MECR 0.052 trans-2-enoyl-CoA reductase, mitochondrial isoform a... CRYZ 0.050 crystallin, zeta isoform c RTN4IP1 0.049 reticulon 4 interacting protein 1 precursor MECR 0.047 trans-2-enoyl-CoA reductase, mitochondrial isoform b... VAT1 0.042 vesicle amine transport protein 1 FASN 0.038 fatty acid synthase CRYZL1 0.016 crystallin, zeta-like 1 ADH1C 0.009 class I alcohol dehydrogenase, gamma subunit AOC3 0.009 amine oxidase, copper containing 3 precursor ADH1A 0.008 class I alcohol dehydrogenase, alpha subunit ADH1B 0.008 class I alcohol dehydrogenase, beta subunit C11orf41 0.008 hypothetical protein LOC25758 CASZ1 0.006 castor homolog 1, zinc finger isoform a CASZ1 0.006 castor homolog 1, zinc finger isoform bHuman BLASTP results (used to prepare the table) | |||
Gene descriptions are from NCBI RefSeq. Search results were obtained with NCBI BLAST and RefSeq entries. When identical proteins are present, the self-match may not be listed first in BLASTP output. In such cases, the table above has been reordered to place it first.
See About the Figures for the scoring system used in the figure above right. The same scoring system was used in the table of BLASTP results.
Guide to the Human Genome
Copyright © 2010 by Stewart Scherer. All rights reserved.
