| Name: CSAD | Sequence: fasta or formatted (520aa) | NCBI GI: 194294551 | |
|
Description: cysteine sulfinic acid decarboxylase
|
Referenced in: Amino Acid Catabolism
| ||
|
Composition:

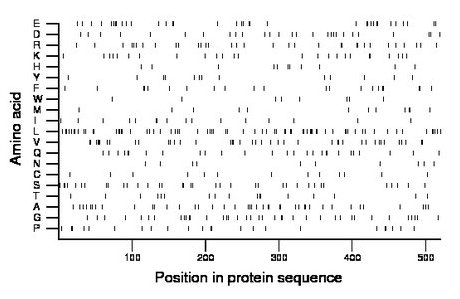
Amino acid Percentage Count Longest homopolymer A alanine 8.1 42 2 C cysteine 2.5 13 1 D aspartate 5.2 27 1 E glutamate 6.9 36 3 F phenylalanine 4.0 21 2 G glycine 7.3 38 2 H histidine 2.1 11 1 I isoleucine 3.1 16 2 K lysine 4.8 25 2 L leucine 13.3 69 3 M methionine 2.5 13 2 N asparagine 1.9 10 1 P proline 4.4 23 2 Q glutamine 5.2 27 2 R arginine 6.3 33 2 S serine 6.9 36 2 T threonine 3.3 17 2 V valine 8.1 42 3 W tryptophan 1.5 8 1 Y tyrosine 2.5 13 1 |
Comparative genomics:
Search single species RefSeq proteins at NCBI
Search summary 
Figure data | ||
Related human proteins:Protein Relative score Description Self-match 1.000 cysteine sulfinic acid decarboxylase GADL1 0.598 glutamate decarboxylase-like 1 GAD2 0.495 glutamate decarboxylase 2 GAD2 0.495 glutamate decarboxylase 2 GAD1 0.494 glutamate decarboxylase 1 isoform GAD67 DDC 0.091 dopa decarboxylase (aromatic L-amino acid decarboxy... DDC 0.091 dopa decarboxylase (aromatic L-amino acid decarboxyla... HDC 0.083 histidine decarboxylase GAD1 0.048 glutamate decarboxylase 1 isoform GAD25 PDXDC1 0.028 pyridoxal-dependent decarboxylase domain containing... SGPL1 0.009 sphingosine-1-phosphate lyase 1 LOC100291802 0.007 PREDICTED: hypothetical protein XP_002346199 LOC100291215 0.007 PREDICTED: hypothetical protein XP_002347079 LOC100287684 0.007 PREDICTED: hypothetical protein XP_002342945 AARS2 0.006 alanyl-tRNA synthetase 2, mitochondrial INO80D 0.005 INO80 complex subunit D HERC2 0.005 hect domain and RLD 2 AGXT 0.005 alanine-glyoxylate aminotransferase CAPS 0.005 calcyphosine isoform a ITSN2 0.005 intersectin 2 isoform 3 ITSN2 0.005 intersectin 2 isoform 1 ITSN2 0.005 intersectin 2 isoform 2 NFS1 0.004 NFS1 nitrogen fixation 1Human BLASTP results (used to prepare the table) | |||
Gene descriptions are from NCBI RefSeq. Search results were obtained with NCBI BLAST and RefSeq entries. When identical proteins are present, the self-match may not be listed first in BLASTP output. In such cases, the table above has been reordered to place it first.
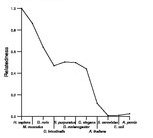
See About the Figures for the scoring system used in the figure above right. The same scoring system was used in the table of BLASTP results.
Guide to the Human Genome
Copyright © 2010 by Stewart Scherer. All rights reserved.
