| Name: LOC649458 | Sequence: fasta or formatted (229aa) | NCBI GI: 169162681 | |
|
Description: PREDICTED: hypothetical protein LOC649458
|
Referenced in: Additional Host Defense Functions
| ||
Other entries for this name:
alt mRNA [229aa] PREDICTED: similar to hCG2036669 alt mRNA [229aa] PREDICTED: similar to hCG2036669 | |||
|
Composition:

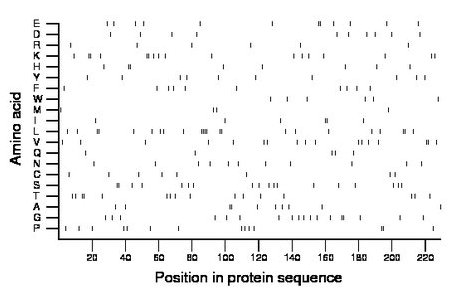
Amino acid Percentage Count Longest homopolymer A alanine 4.4 10 2 C cysteine 3.5 8 1 D aspartate 4.4 10 1 E glutamate 5.2 12 2 F phenylalanine 4.4 10 1 G glycine 7.9 18 2 H histidine 3.5 8 2 I isoleucine 2.6 6 2 K lysine 7.4 17 2 L leucine 10.0 23 4 M methionine 1.7 4 1 N asparagine 4.8 11 1 P proline 6.1 14 2 Q glutamine 2.2 5 1 R arginine 2.6 6 1 S serine 7.9 18 2 T threonine 7.0 16 2 V valine 7.4 17 2 W tryptophan 2.6 6 1 Y tyrosine 4.4 10 1 |
Comparative genomics:
Search single species RefSeq proteins at NCBI
Search summary 
Figure data | ||
Related human proteins:Protein Relative score Description Self-match 1.000 PREDICTED: hypothetical protein LOC649458 LOC649458 1.000 PREDICTED: similar to hCG2036669 LOC649458 1.000 PREDICTED: similar to hCG2036669 APCS 0.297 serum amyloid P component precursor CRP 0.256 C-reactive protein, pentraxin-related SVEP1 0.084 polydom NPTXR 0.082 neuronal pentraxin receptor C16orf38 0.071 hypothetical protein LOC390667 NPTX2 0.062 neuronal pentraxin II GPR144 0.058 G protein-coupled receptor 144 NPTX1 0.056 neuronal pentraxin I precursor PTX3 0.054 pentraxin 3 LOC100291782 0.009 PREDICTED: hypothetical protein XP_002346152 LOC100289951 0.009 PREDICTED: hypothetical protein XP_002347042 LOC100287492 0.009 PREDICTED: hypothetical protein XP_002342893 GPR112 0.009 G-protein coupled receptor 112 KIAA1024 0.006 hypothetical protein LOC23251 FAM178A 0.006 hypothetical protein LOC55719 isoform 1 FAM178A 0.006 hypothetical protein LOC55719 isoform 2Human BLASTP results (used to prepare the table) | |||
Gene descriptions are from NCBI RefSeq. Search results were obtained with NCBI BLAST and RefSeq entries. When identical proteins are present, the self-match may not be listed first in BLASTP output. In such cases, the table above has been reordered to place it first.
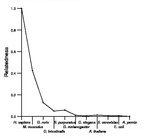
See About the Figures for the scoring system used in the figure above right. The same scoring system was used in the table of BLASTP results.
Guide to the Human Genome
Copyright © 2010 by Stewart Scherer. All rights reserved.
