
| Name: MAGEA8 | Sequence: fasta or formatted (318aa) | NCBI GI: 19923308 | |
|
Description: melanoma antigen family A, 8
|
Referenced in:
| ||
|
Composition:
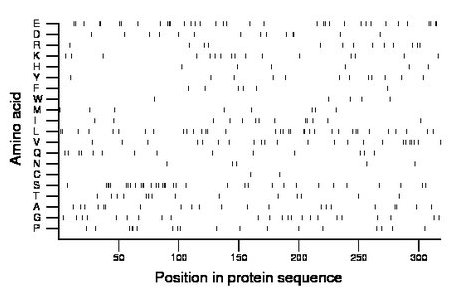
Amino acid Percentage Count Longest homopolymer A alanine 6.6 21 2 C cysteine 0.6 2 1 D aspartate 4.4 14 2 E glutamate 11.3 36 3 F phenylalanine 1.9 6 1 G glycine 7.2 23 1 H histidine 1.9 6 1 I isoleucine 4.1 13 2 K lysine 5.0 16 1 L leucine 11.0 35 2 M methionine 2.5 8 1 N asparagine 1.6 5 1 P proline 5.7 18 2 Q glutamine 4.4 14 1 R arginine 4.1 13 1 S serine 10.7 34 4 T threonine 4.4 14 1 V valine 7.2 23 2 W tryptophan 1.6 5 1 Y tyrosine 3.8 12 1 |
Comparative genomics:
Search single species RefSeq proteins at NCBI
Search summary 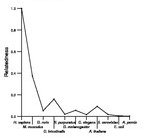
Figure data | ||
Related human proteins:Protein Relative score Description Self-match 1.000 melanoma antigen family A, 8 MAGEA4 0.662 melanoma antigen family A, 4 MAGEA4 0.662 melanoma antigen family A, 4 MAGEA4 0.662 melanoma antigen family A, 4 MAGEA4 0.662 melanoma antigen family A, 4 MAGEA9B 0.616 melanoma antigen family A, 9 -like MAGEA9 0.616 melanoma antigen family A, 9 MAGEA1 0.612 melanoma antigen family A, 1 MAGEA12 0.594 melanoma antigen family A, 12 MAGEA2 0.589 melanoma antigen family A, 2 MAGEA2 0.589 melanoma antigen family A, 2 MAGEA2 0.589 melanoma antigen family A, 2 MAGEA2B 0.589 melanoma antigen family A, 2B MAGEA6 0.587 melanoma antigen family A, 6 MAGEA6 0.587 melanoma antigen family A, 6 MAGEA3 0.584 melanoma antigen family A, 3 MAGEA11 0.569 melanoma antigen family A, 11 isoform b MAGEA11 0.569 melanoma antigen family A, 11 isoform a MAGEA10 0.536 melanoma antigen family A, 10 MAGEA10 0.536 melanoma antigen family A, 10 MAGEB16 0.419 melanoma antigen family B, 16 MAGEB4 0.376 melanoma antigen family B, 4 MAGEB17 0.375 PREDICTED: melanoma antigen family B, 17 MAGEB17 0.375 PREDICTED: melanoma antigen family B, 17 MAGEB17 0.375 PREDICTED: melanoma antigen family B, 17 MAGEB1 0.373 melanoma antigen family B, 1 MAGEB1 0.373 melanoma antigen family B, 1 MAGEB1 0.373 melanoma antigen family B, 1 MAGEB10 0.368 melanoma antigen family B, 10 MAGEB18 0.365 melanoma antigen family B, 18Human BLASTP results (used to prepare the table) | |||
Gene descriptions are from NCBI RefSeq. Search results were obtained with NCBI BLAST and RefSeq entries. When identical proteins are present, the self-match may not be listed first in BLASTP output. In such cases, the table above has been reordered to place it first.
See About the Figures for the scoring system used in the figure above right. The same scoring system was used in the table of BLASTP results.
Guide to the Human Genome
Copyright © 2010 by Stewart Scherer. All rights reserved.
