
| Name: TSPAN17 | Sequence: fasta or formatted (329aa) | NCBI GI: 50511934 | |
|
Description: transmembrane 4 superfamily member 17 isoform b
|
Referenced in: Cullins and SCF Complexes
| ||
Other entries for this name:
alt prot [266aa] transmembrane 4 superfamily member 17 isoform c alt prot [332aa] transmembrane 4 superfamily member 17 isoform a | |||
|
Composition:
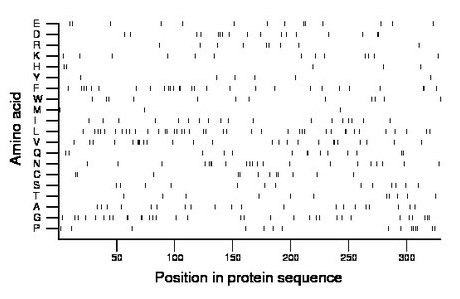
Amino acid Percentage Count Longest homopolymer A alanine 6.1 20 1 C cysteine 3.6 12 2 D aspartate 5.2 17 2 E glutamate 4.3 14 1 F phenylalanine 8.5 28 2 G glycine 10.0 33 2 H histidine 1.5 5 1 I isoleucine 5.5 18 1 K lysine 4.0 13 1 L leucine 12.2 40 2 M methionine 0.9 3 1 N asparagine 6.4 21 3 P proline 4.6 15 2 Q glutamine 4.3 14 2 R arginine 2.7 9 1 S serine 4.0 13 1 T threonine 3.3 11 1 V valine 7.6 25 3 W tryptophan 3.6 12 1 Y tyrosine 1.8 6 1 |
Comparative genomics:
Search single species RefSeq proteins at NCBI
Search summary 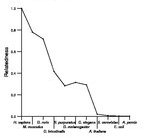
Figure data | ||
Related human proteins:Protein Relative score Description Self-match 1.000 transmembrane 4 superfamily member 17 isoform b [Hom... TSPAN17 0.993 transmembrane 4 superfamily member 17 isoform a [Hom... TSPAN17 0.767 transmembrane 4 superfamily member 17 isoform c [Hom... TSPAN5 0.653 transmembrane 4 superfamily member 9 TSPAN14 0.460 tetraspanin 14 isoform 1 TSPAN33 0.310 tetraspanin 33 TSPAN15 0.211 transmembrane 4 superfamily member 15 TSPAN14 0.203 tetraspanin 14 isoform 2 TSPAN10 0.181 tetraspanin 10 CD63 0.131 CD63 antigen isoform A TSPAN7 0.129 tetraspanin 7 CD82 0.129 CD82 antigen isoform 1 CD63 0.122 CD63 antigen isoform B CD151 0.120 CD151 antigen CD151 0.120 CD151 antigen CD151 0.120 CD151 antigen CD151 0.120 CD151 antigen TSPAN18 0.120 tetraspanin 18 isoform 2 TSPAN4 0.119 tetraspanin 4 isoform a TSPAN4 0.119 tetraspanin 4 isoform a TSPAN4 0.119 tetraspanin 4 isoform a TSPAN4 0.119 tetraspanin 4 isoform a TSPAN4 0.119 tetraspanin 4 isoform a TSPAN4 0.119 tetraspanin 4 isoform a TSPAN9 0.119 tetraspanin 9 TSPAN6 0.116 transmembrane 4 superfamily member 6 TSPAN11 0.113 tetraspanin 11 TSPAN18 0.111 tetraspanin 18 isoform 1 TSPAN8 0.110 transmembrane 4 superfamily member 3 CD82 0.107 CD82 antigen isoform 2Human BLASTP results (used to prepare the table) | |||
Gene descriptions are from NCBI RefSeq. Search results were obtained with NCBI BLAST and RefSeq entries. When identical proteins are present, the self-match may not be listed first in BLASTP output. In such cases, the table above has been reordered to place it first.
See About the Figures for the scoring system used in the figure above right. The same scoring system was used in the table of BLASTP results.
Guide to the Human Genome
Copyright © 2010 by Stewart Scherer. All rights reserved.
