
| Name: EREG | Sequence: fasta or formatted (169aa) | NCBI GI: 4557567 | |
|
Description: epiregulin preproprotein
|
Referenced in:
| ||
|
Composition:
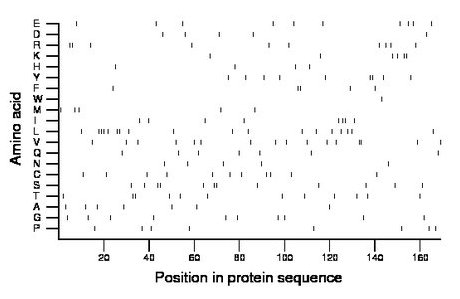
Amino acid Percentage Count Longest homopolymer A alanine 4.1 7 1 C cysteine 6.5 11 1 D aspartate 3.0 5 1 E glutamate 5.9 10 1 F phenylalanine 3.0 5 2 G glycine 5.9 10 1 H histidine 2.4 4 1 I isoleucine 4.7 8 2 K lysine 3.6 6 2 L leucine 10.7 18 3 M methionine 3.0 5 1 N asparagine 3.0 5 1 P proline 4.7 8 1 Q glutamine 4.1 7 1 R arginine 5.9 10 2 S serine 7.1 12 2 T threonine 7.1 12 2 V valine 9.5 16 2 W tryptophan 0.6 1 1 Y tyrosine 5.3 9 2 |
Comparative genomics:
Search single species RefSeq proteins at NCBI
Search summary 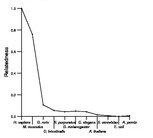
Figure data | ||
Related human proteins:Protein Relative score Description Self-match 1.000 epiregulin preproprotein EGF 0.095 epidermal growth factor (beta-urogastrone) BTC 0.095 betacellulin EPGN 0.091 epithelial mitogen TMEFF2 0.088 transmembrane protein with EGF-like and two follista... NRG2 0.085 neuregulin 2 isoform 2 TMEFF1 0.082 transmembrane protein with EGF-like and two follista... TGFA 0.079 transforming growth factor, alpha isoform 1 NRG4 0.073 neuregulin 4 TGFA 0.073 transforming growth factor, alpha isoform 2 NRG2 0.073 neuregulin 2 isoform 4 AREG 0.061 amphiregulin preproprotein AREGB 0.061 PREDICTED: amphiregulin B HBEGF 0.052 heparin-binding EGF-like growth factor LRP1 0.049 low density lipoprotein-related protein 1 NRG3 0.049 neuregulin 3 NRG2 0.049 neuregulin 2 isoform 1 NRG1 0.043 neuregulin 1 isoform ndf43b NRG1 0.043 neuregulin 1 isoform HRG-beta2b NRG1 0.043 neuregulin 1 isoform HRG-beta2 LRP2 0.043 low density lipoprotein-related protein 2 NRG1 0.040 neuregulin 1 isoform ndf43c NRG1 0.040 neuregulin 1 isoform HRG-alpha NRG1 0.040 neuregulin 1 isoform ndf43 NRG2 0.040 neuregulin 2 isoform 3 CSPG5 0.037 chondroitin sulfate proteoglycan 5 (neuroglycan C) ... NRG1 0.037 neuregulin 1 isoform HRG-beta1d NRG1 0.037 neuregulin 1 isoform HRG-beta1b NRG1 0.037 neuregulin 1 isoform HRG-beta1c NRG1 0.037 neuregulin 1 isoform HRG-beta1Human BLASTP results (used to prepare the table) | |||
Gene descriptions are from NCBI RefSeq. Search results were obtained with NCBI BLAST and RefSeq entries. When identical proteins are present, the self-match may not be listed first in BLASTP output. In such cases, the table above has been reordered to place it first.
See About the Figures for the scoring system used in the figure above right. The same scoring system was used in the table of BLASTP results.
Guide to the Human Genome
Copyright © 2010 by Stewart Scherer. All rights reserved.
