
| Name: H3F3A | Sequence: fasta or formatted (136aa) | NCBI GI: 4504279 | |
|
Description: H3 histone, family 3A
|
Referenced in: Histones, Related Proteins, and Modifying Enzymes
| ||
|
Composition:
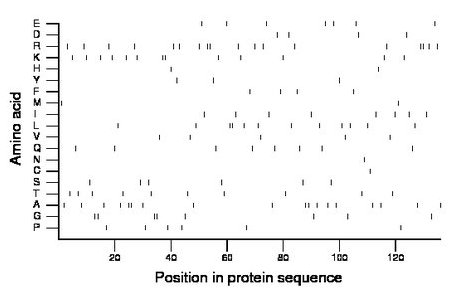
Amino acid Percentage Count Longest homopolymer A alanine 13.2 18 2 C cysteine 0.7 1 1 D aspartate 2.9 4 1 E glutamate 5.1 7 1 F phenylalanine 2.9 4 1 G glycine 5.9 8 2 H histidine 1.5 2 1 I isoleucine 5.9 8 1 K lysine 9.6 13 2 L leucine 8.8 12 2 M methionine 1.5 2 1 N asparagine 0.7 1 1 P proline 4.4 6 1 Q glutamine 5.9 8 1 R arginine 13.2 18 2 S serine 4.4 6 1 T threonine 7.4 10 1 V valine 3.7 5 1 W tryptophan 0.0 0 0 Y tyrosine 2.2 3 1 |
Comparative genomics:
Search single species RefSeq proteins at NCBI
Search summary 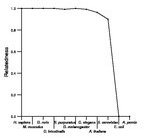
Figure data | ||
Related human proteins:Protein Relative score Description Self-match 1.000 H3 histone, family 3A H3F3B 1.000 H3 histone, family 3B HIST2H3A 0.971 histone cluster 2, H3a HIST2H3C 0.971 histone cluster 2, H3c HIST2H3D 0.971 histone cluster 2, H3d HIST1H3E 0.963 histone cluster 1, H3e HIST1H3H 0.963 histone cluster 1, H3h HIST1H3I 0.963 histone cluster 1, H3i HIST1H3A 0.963 histone cluster 1, H3a HIST1H3F 0.963 histone cluster 1, H3f HIST1H3D 0.963 histone cluster 1, H3d HIST1H3B 0.963 histone cluster 1, H3b HIST1H3J 0.963 histone cluster 1, H3j HIST1H3C 0.963 histone cluster 1, H3c HIST1H3G 0.963 H3 histone family, member H HIST3H3 0.942 histone cluster 3, H3 LOC440093 0.929 histone H3-like LOC340096 0.821 PREDICTED: similar to hCG1642908 LOC391769 0.804 PREDICTED: similar to HIStone family member (his-72... LOC391769 0.804 PREDICTED: similar to HIStone family member (his-72)... LOC391769 0.804 PREDICTED: similar to HIStone family member (his-72)... LOC644950 0.787 PREDICTED: similar to histone H3.3B LOC340096 0.579 PREDICTED: similar to hCG1642908 LOC340096 0.579 PREDICTED: similar to hCG1642908 CENPA 0.350 centromere protein A isoform a CENPA 0.242 centromere protein A isoform b CENPT 0.029 centromere protein T H2BFM 0.029 PREDICTED: H2B histone family, member M H2BFM 0.029 PREDICTED: H2B histone family, member M ZFP37 0.029 zinc finger protein 37 homologHuman BLASTP results (used to prepare the table) | |||
Gene descriptions are from NCBI RefSeq. Search results were obtained with NCBI BLAST and RefSeq entries. When identical proteins are present, the self-match may not be listed first in BLASTP output. In such cases, the table above has been reordered to place it first.
See About the Figures for the scoring system used in the figure above right. The same scoring system was used in the table of BLASTP results.
Guide to the Human Genome
Copyright © 2010 by Stewart Scherer. All rights reserved.
