
| Name: EXTL3 | Sequence: fasta or formatted (919aa) | NCBI GI: 4503617 | |
|
Description: exostoses-like 3
|
Referenced in:
| ||
|
Composition:
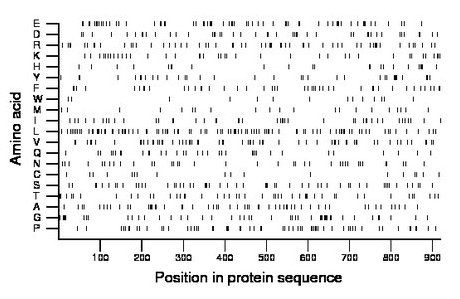
Amino acid Percentage Count Longest homopolymer A alanine 6.4 59 3 C cysteine 2.0 18 1 D aspartate 5.1 47 3 E glutamate 6.9 63 3 F phenylalanine 5.1 47 2 G glycine 5.3 49 3 H histidine 2.5 23 1 I isoleucine 4.7 43 2 K lysine 4.4 40 2 L leucine 10.9 100 2 M methionine 2.4 22 1 N asparagine 4.1 38 2 P proline 6.7 62 3 Q glutamine 3.7 34 1 R arginine 6.3 58 2 S serine 6.0 55 2 T threonine 5.1 47 2 V valine 7.1 65 4 W tryptophan 1.5 14 1 Y tyrosine 3.8 35 2 |
Comparative genomics:
Search single species RefSeq proteins at NCBI
Search summary 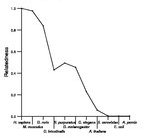
Figure data | ||
Related human proteins:Protein Relative score Description Self-match 1.000 exostoses-like 3 EXT2 0.132 exostosin 2 isoform 2 EXT2 0.132 exostosin 2 isoform 1 EXT1 0.099 exostosin 1 EXTL1 0.070 exostoses-like 1 EXTL2 0.060 exostoses-like 2 EXTL2 0.060 exostoses-like 2 MCC 0.009 mutated in colorectal cancers isoform 1 MCC 0.009 mutated in colorectal cancers isoform 2 GKAP1 0.008 G kinase anchoring protein 1 isoform a CGN 0.007 cingulin KIF20B 0.006 M-phase phosphoprotein 1 SYNE2 0.006 spectrin repeat containing, nuclear envelope 2 isof... SYNE2 0.006 spectrin repeat containing, nuclear envelope 2 isof... MYH1 0.005 myosin, heavy chain 1, skeletal muscle, adult [Homo... MYH2 0.005 myosin, heavy chain 2, skeletal muscle, adult [Homo... MYH2 0.005 myosin, heavy chain 2, skeletal muscle, adult [Homo... GKAP1 0.005 G kinase anchoring protein 1 isoform b GCC2 0.005 GRIP and coiled-coil domain-containing 2 ENPP1 0.005 ectonucleotide pyrophosphatase/phosphodiesterase 1 ... GOLGB1 0.005 golgi autoantigen, golgin subfamily b, macrogolgin ... PLEC1 0.005 plectin 1 isoform 11 PLEC1 0.005 plectin 1 isoform 10 PLEC1 0.005 plectin 1 isoform 8 PLEC1 0.005 plectin 1 isoform 7 PLEC1 0.005 plectin 1 isoform 6 PLEC1 0.005 plectin 1 isoform 3 PLEC1 0.005 plectin 1 isoform 2 PLEC1 0.005 plectin 1 isoform 1 CCDC18 0.005 sarcoma antigen NY-SAR-41Human BLASTP results (used to prepare the table) | |||
Gene descriptions are from NCBI RefSeq. Search results were obtained with NCBI BLAST and RefSeq entries. When identical proteins are present, the self-match may not be listed first in BLASTP output. In such cases, the table above has been reordered to place it first.
See About the Figures for the scoring system used in the figure above right. The same scoring system was used in the table of BLASTP results.
Guide to the Human Genome
Copyright © 2010 by Stewart Scherer. All rights reserved.
