
| Name: GPR55 | Sequence: fasta or formatted (319aa) | NCBI GI: 33695107 | |
|
Description: G protein-coupled receptor 55
|
Referenced in:
| ||
|
Composition:
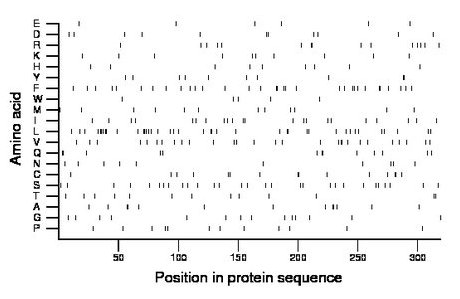
Amino acid Percentage Count Longest homopolymer A alanine 4.1 13 2 C cysteine 4.7 15 2 D aspartate 3.4 11 2 E glutamate 1.9 6 1 F phenylalanine 10.0 32 2 G glycine 4.4 14 1 H histidine 2.8 9 1 I isoleucine 6.9 22 1 K lysine 3.1 10 1 L leucine 12.5 40 3 M methionine 3.8 12 1 N asparagine 3.1 10 1 P proline 3.8 12 1 Q glutamine 4.1 13 2 R arginine 4.7 15 2 S serine 9.1 29 1 T threonine 4.1 13 2 V valine 8.8 28 2 W tryptophan 1.6 5 1 Y tyrosine 3.1 10 2 |
Comparative genomics:
Search single species RefSeq proteins at NCBI
Search summary 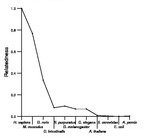
Figure data | ||
Related human proteins:Protein Relative score Description Self-match 1.000 G protein-coupled receptor 55 LPAR4 0.190 lysophosphatidic acid receptor 4 GPR35 0.186 G protein-coupled receptor 35 LPAR6 0.183 G-protein coupled purinergic receptor P2Y5 LPAR6 0.183 G-protein coupled purinergic receptor P2Y5 LPAR6 0.183 G-protein coupled purinergic receptor P2Y5 LPAR5 0.165 lysophosphatidic acid receptor 5 LPAR5 0.165 lysophosphatidic acid receptor 5 GPR174 0.141 putative purinergic receptor FKSG79 CCR4 0.135 chemokine (C-C motif) receptor 4 GPR183 0.130 EBV-induced G protein-coupled receptor 2 CCR8 0.127 chemokine (C-C motif) receptor 8 AGTR2 0.119 angiotensin II receptor, type 2 CX3CR1 0.117 chemokine (C-X3-C motif) receptor 1 P2RY10 0.117 G-protein coupled purinergic receptor P2Y10 P2RY10 0.117 G-protein coupled purinergic receptor P2Y10 F2R 0.114 coagulation factor II receptor precursor CCBP2 0.113 chemokine binding protein 2 CCR1 0.113 chemokine (C-C motif) receptor 1 PTAFR 0.111 platelet-activating factor receptor P2RY8 0.110 G-protein coupled purinergic receptor P2Y8 GPR18 0.110 G protein-coupled receptor 18 GPR18 0.110 G protein-coupled receptor 18 CCR9 0.108 chemokine (C-C motif) receptor 9 isoform B CCR9 0.108 chemokine (C-C motif) receptor 9 isoform A P2RY6 0.108 pyrimidinergic receptor P2Y6 P2RY6 0.108 pyrimidinergic receptor P2Y6 P2RY6 0.108 pyrimidinergic receptor P2Y6 P2RY6 0.108 pyrimidinergic receptor P2Y6 OPRK1 0.106 opioid receptor, kappa 1Human BLASTP results (used to prepare the table) | |||
Gene descriptions are from NCBI RefSeq. Search results were obtained with NCBI BLAST and RefSeq entries. When identical proteins are present, the self-match may not be listed first in BLASTP output. In such cases, the table above has been reordered to place it first.
See About the Figures for the scoring system used in the figure above right. The same scoring system was used in the table of BLASTP results.
Guide to the Human Genome
Copyright © 2010 by Stewart Scherer. All rights reserved.
