
| Name: NPBWR1 | Sequence: fasta or formatted (328aa) | NCBI GI: 53828924 | |
|
Description: G protein-coupled receptor 7
|
Referenced in: Peptide and Protein G-coupled Signals
| ||
|
Composition:
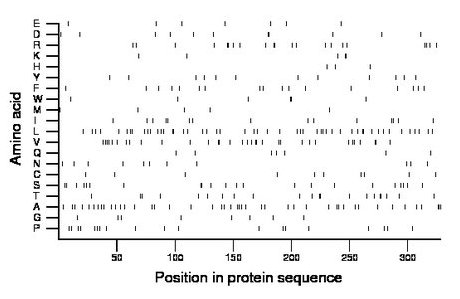
Amino acid Percentage Count Longest homopolymer A alanine 13.7 45 3 C cysteine 3.0 10 1 D aspartate 3.4 11 2 E glutamate 2.1 7 1 F phenylalanine 5.2 17 1 G glycine 2.4 8 1 H histidine 0.9 3 1 I isoleucine 4.6 15 1 K lysine 1.5 5 2 L leucine 15.2 50 2 M methionine 1.5 5 1 N asparagine 3.4 11 1 P proline 5.8 19 1 Q glutamine 2.1 7 1 R arginine 6.4 21 2 S serine 6.7 22 2 T threonine 6.4 21 2 V valine 10.1 33 2 W tryptophan 1.8 6 2 Y tyrosine 3.7 12 1 |
Comparative genomics:
Search single species RefSeq proteins at NCBI
Search summary 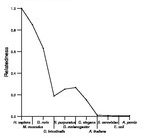
Figure data | ||
Related human proteins:Protein Relative score Description Self-match 1.000 G protein-coupled receptor 7 NPBWR2 0.590 neuropeptides B/W receptor 2 SSTR3 0.347 somatostatin receptor 3 OPRD1 0.342 opioid receptor, delta 1 SSTR2 0.326 somatostatin receptor 2 SSTR1 0.325 somatostatin receptor 1 OPRL1 0.322 opiate receptor-like 1 OPRL1 0.322 opiate receptor-like 1 SSTR5 0.314 somatostatin receptor 5 OPRM1 0.314 opioid receptor, mu 1 isoform MOR-1H OPRM1 0.314 opioid receptor, mu 1 isoform MOR-1 OPRM1 0.314 opioid receptor, mu 1 isoform MOR-1B5 OPRM1 0.314 opioid receptor, mu 1 isoform MOR-1B2 OPRM1 0.314 opioid receptor, mu 1 isoform MOR-1B3 OPRM1 0.314 opioid receptor, mu 1 isoform MOR-1B1 OPRM1 0.314 opioid receptor, mu 1 isoform MOR-1A OPRM1 0.314 opioid receptor, mu 1 isoform MOR-1B4 OPRM1 0.314 opioid receptor, mu 1 isoform MOR-1O OPRM1 0.314 opioid receptor, mu 1 isoform MOR-1X OPRK1 0.301 opioid receptor, kappa 1 SSTR4 0.296 somatostatin receptor 4 OPRM1 0.268 opioid receptor, mu 1 isoform MOR-1G2 OPRM1 0.265 opioid receptor, mu 1 isoform MOR-1G1 OPRM1 0.265 opioid receptor, mu 1 isoform MOR1-K1 MCHR1 0.214 G protein-coupled receptor 24 RXFP3 0.195 relaxin/insulin-like family peptide receptor 3 KISS1R 0.193 G protein-coupled receptor 54 GALR2 0.191 galanin receptor 2 CCR1 0.186 chemokine (C-C motif) receptor 1 CCR3 0.186 CC chemokine receptor 3Human BLASTP results (used to prepare the table) | |||
Gene descriptions are from NCBI RefSeq. Search results were obtained with NCBI BLAST and RefSeq entries. When identical proteins are present, the self-match may not be listed first in BLASTP output. In such cases, the table above has been reordered to place it first.
See About the Figures for the scoring system used in the figure above right. The same scoring system was used in the table of BLASTP results.
Guide to the Human Genome
Copyright © 2010 by Stewart Scherer. All rights reserved.
