
| Name: RIMBP3C | Sequence: fasta or formatted (1639aa) | NCBI GI: 191252806 | |
|
Description: RIMS binding protein 3C
| Not currently referenced in the text | ||
|
Composition:
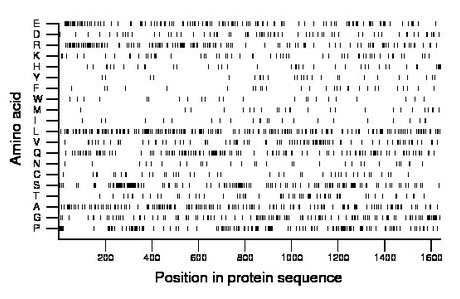
Amino acid Percentage Count Longest homopolymer A alanine 9.0 147 3 C cysteine 2.6 42 1 D aspartate 4.3 71 2 E glutamate 8.5 139 3 F phenylalanine 1.8 30 2 G glycine 7.4 122 2 H histidine 2.4 40 2 I isoleucine 1.5 25 2 K lysine 3.6 59 2 L leucine 10.9 179 2 M methionine 1.6 26 1 N asparagine 1.9 31 1 P proline 7.9 130 6 Q glutamine 7.5 123 3 R arginine 8.4 137 3 S serine 8.5 140 3 T threonine 3.5 58 1 V valine 5.4 88 2 W tryptophan 1.4 23 1 Y tyrosine 1.8 29 2 |
Comparative genomics:
Search single species RefSeq proteins at NCBI
Search summary 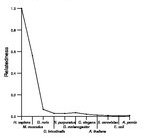
Figure data | ||
Related human proteins:Protein Relative score Description Self-match 1.000 RIMS binding protein 3C RIMBP3B 0.999 RIMS binding protein 3B RIMBP3 0.992 DKFZP434H0735 protein BZRAP1 0.104 peripheral benzodiazepine receptor-associated prote... RIMBP2 0.085 RIM-binding protein 2 BZRAP1 0.074 peripheral benzodiazepine receptor-associated prote... MAP4K4 0.016 mitogen-activated protein kinase kinase kinase kinas... PLEC1 0.015 plectin 1 isoform 11 PLEC1 0.015 plectin 1 isoform 10 PLEC1 0.015 plectin 1 isoform 8 PLEC1 0.015 plectin 1 isoform 7 PLEC1 0.015 plectin 1 isoform 6 PLEC1 0.015 plectin 1 isoform 3 PLEC1 0.015 plectin 1 isoform 2 PLEC1 0.015 plectin 1 isoform 1 MAP4K4 0.014 mitogen-activated protein kinase kinase kinase kinas... MAP4K4 0.014 mitogen-activated protein kinase kinase kinase kinas... ENAH 0.011 enabled homolog isoform a ENAH 0.011 enabled homolog isoform b JAKMIP3 0.011 Janus kinase and microtubule interacting protein 3 ... GIGYF2 0.011 GRB10 interacting GYF protein 2 isoform c GIGYF2 0.011 GRB10 interacting GYF protein 2 isoform a GIGYF2 0.011 GRB10 interacting GYF protein 2 isoform b GIGYF2 0.011 GRB10 interacting GYF protein 2 isoform b TCHH 0.011 trichohyalin TNIK 0.010 TRAF2 and NCK interacting kinase isoform 6 TNIK 0.010 TRAF2 and NCK interacting kinase isoform 5 TNIK 0.010 TRAF2 and NCK interacting kinase isoform 2 TNIK 0.010 TRAF2 and NCK interacting kinase isoform 1 SFRS17A 0.010 DNA segment on chromosome X and Y (unique) 155 expre...Human BLASTP results (used to prepare the table) | |||
Gene descriptions are from NCBI RefSeq. Search results were obtained with NCBI BLAST and RefSeq entries. When identical proteins are present, the self-match may not be listed first in BLASTP output. In such cases, the table above has been reordered to place it first.
See About the Figures for the scoring system used in the figure above right. The same scoring system was used in the table of BLASTP results.
Guide to the Human Genome
Copyright © 2010 by Stewart Scherer. All rights reserved.
