| Name: POLM | Sequence: fasta or formatted (494aa) | NCBI GI: 7019493 | |
|
Description: DNA-directed DNA polymerase mu
|
Referenced in:
| ||
|
Composition:

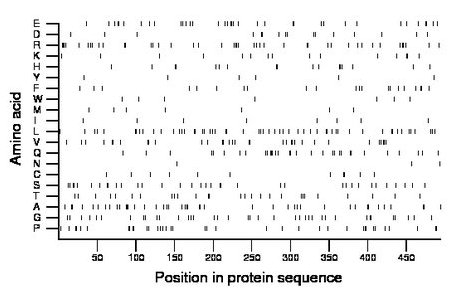
Amino acid Percentage Count Longest homopolymer A alanine 8.7 43 3 C cysteine 2.2 11 2 D aspartate 3.2 16 2 E glutamate 7.5 37 2 F phenylalanine 4.3 21 2 G glycine 7.9 39 2 H histidine 3.4 17 2 I isoleucine 1.6 8 1 K lysine 3.0 15 1 L leucine 11.1 55 2 M methionine 1.6 8 1 N asparagine 0.6 3 1 P proline 7.5 37 2 Q glutamine 6.5 32 3 R arginine 8.9 44 3 S serine 7.1 35 2 T threonine 5.5 27 2 V valine 6.7 33 2 W tryptophan 1.4 7 1 Y tyrosine 1.2 6 1 |
Comparative genomics:
Search single species RefSeq proteins at NCBI
Search summary 
Figure data | ||
Related human proteins:Protein Relative score Description Self-match 1.000 DNA-directed DNA polymerase mu DNTT 0.359 terminal deoxynucleotidyltransferase isoform 1 [Homo... DNTT 0.355 terminal deoxynucleotidyltransferase isoform 2 [Homo... POLL 0.155 DNA-directed DNA polymerase lambda POLB 0.087 DNA-directed DNA polymerase beta CDC25C 0.011 cell division cycle 25C isoform b CDC25C 0.009 cell division cycle 25C isoform a CEP164 0.009 centrosomal protein 164kDa LOC100134060 0.008 PREDICTED: hypothetical protein FHDC1 0.008 FH2 domain containing 1 FLJ22184 0.007 PREDICTED: hypothetical protein FLJ22184 GDF6 0.006 growth differentiation factor 6 precursor SIGLEC1 0.006 sialoadhesin precursor LOC100291737 0.005 PREDICTED: hypothetical protein XP_002345024 LOC100290757 0.005 PREDICTED: hypothetical protein XP_002347750 LOC100289291 0.005 PREDICTED: hypothetical protein XP_002343521 LMO7 0.005 LIM domain only 7 isoform 2 PRMT1 0.005 HMT1 hnRNP methyltransferase-like 2 isoform 1 [Homo... PRMT1 0.005 HMT1 hnRNP methyltransferase-like 2 isoform 3 [Homo... PRMT1 0.005 HMT1 hnRNP methyltransferase-like 2 isoform 2 [Homo...Human BLASTP results (used to prepare the table) | |||
Gene descriptions are from NCBI RefSeq. Search results were obtained with NCBI BLAST and RefSeq entries. When identical proteins are present, the self-match may not be listed first in BLASTP output. In such cases, the table above has been reordered to place it first.
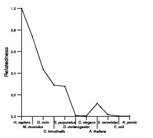
See About the Figures for the scoring system used in the figure above right. The same scoring system was used in the table of BLASTP results.
Guide to the Human Genome
Copyright © 2010 by Stewart Scherer. All rights reserved.
