
| Name: RND2 | Sequence: fasta or formatted (227aa) | NCBI GI: 4885581 | |
|
Description: Rho family GTPase 2
|
Referenced in:
| ||
|
Composition:
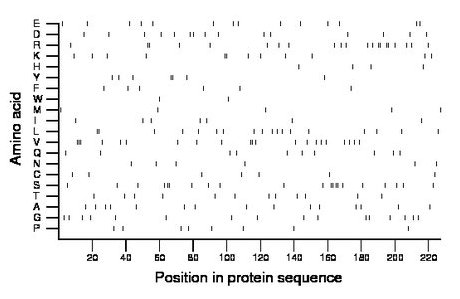
Amino acid Percentage Count Longest homopolymer A alanine 6.6 15 1 C cysteine 3.1 7 1 D aspartate 6.6 15 1 E glutamate 6.2 14 1 F phenylalanine 2.6 6 1 G glycine 7.0 16 1 H histidine 1.8 4 1 I isoleucine 3.1 7 1 K lysine 5.3 12 2 L leucine 7.9 18 2 M methionine 2.2 5 1 N asparagine 2.6 6 1 P proline 3.5 8 1 Q glutamine 4.4 10 1 R arginine 9.3 21 2 S serine 9.3 21 2 T threonine 5.3 12 1 V valine 9.3 21 3 W tryptophan 0.9 2 1 Y tyrosine 3.1 7 2 |
Comparative genomics:
Search single species RefSeq proteins at NCBI
Search summary 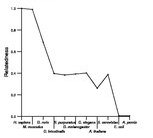
Figure data | ||
Related human proteins:Protein Relative score Description Self-match 1.000 Rho family GTPase 2 RND3 0.654 ras homolog gene family, member E RND1 0.520 GTP-binding protein RHO6 RHOC 0.395 ras homolog gene family, member C precursor RHOC 0.395 ras homolog gene family, member C precursor RHOC 0.395 ras homolog gene family, member C precursor RHOA 0.390 ras homolog gene family, member A RHOB 0.363 ras homolog gene family, member B RHOD 0.339 ras homolog D RAC1 0.339 ras-related C3 botulinum toxin substrate 1 isoform Ra... RAC2 0.328 ras-related C3 botulinum toxin substrate 2 RAC3 0.326 ras-related C3 botulinum toxin substrate 3 (rho famil... RHOF 0.321 ras homolog gene family, member F RAC1 0.312 ras-related C3 botulinum toxin substrate 1 isoform Ra... RHOG 0.307 ras homolog gene family, member G RHOQ 0.293 ras-like protein TC10 CDC42 0.277 cell division cycle 42 isoform 2 CDC42 0.273 cell division cycle 42 isoform 1 CDC42 0.273 cell division cycle 42 isoform 1 RHOU 0.268 ras homolog gene family, member U RHOJ 0.259 ras homolog gene family, member J RHOV 0.215 ras homolog gene family, member V RHOH 0.206 ras homolog gene family, member H RHOBTB2 0.155 Rho-related BTB domain containing 2 isoform 3 [Homo... RHOBTB2 0.155 Rho-related BTB domain containing 2 isoform 2 [Homo... RHOBTB2 0.155 Rho-related BTB domain containing 2 isoform 1 [Homo... RHOBTB1 0.152 Rho-related BTB domain containing 1 RAB3B 0.115 RAB3B, member RAS oncogene family RAB12 0.115 RAB12, member RAS oncogene family RAB19 0.113 RAB19, member RAS oncogene familyHuman BLASTP results (used to prepare the table) | |||
Gene descriptions are from NCBI RefSeq. Search results were obtained with NCBI BLAST and RefSeq entries. When identical proteins are present, the self-match may not be listed first in BLASTP output. In such cases, the table above has been reordered to place it first.
See About the Figures for the scoring system used in the figure above right. The same scoring system was used in the table of BLASTP results.
Guide to the Human Genome
Copyright © 2010 by Stewart Scherer. All rights reserved.
