
| Name: TFAP4 | Sequence: fasta or formatted (338aa) | NCBI GI: 4507447 | |
|
Description: transcription factor AP-4 (activating enhancer binding protein 4)
|
Referenced in:
| ||
|
Composition:
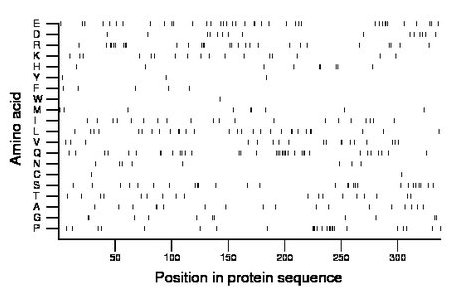
Amino acid Percentage Count Longest homopolymer A alanine 5.3 18 2 C cysteine 0.6 2 1 D aspartate 4.4 15 1 E glutamate 11.5 39 3 F phenylalanine 1.5 5 1 G glycine 3.3 11 2 H histidine 2.7 9 2 I isoleucine 5.9 20 1 K lysine 5.0 17 1 L leucine 8.6 29 2 M methionine 2.7 9 2 N asparagine 2.4 8 1 P proline 7.4 25 5 Q glutamine 10.7 36 4 R arginine 8.3 28 3 S serine 8.0 27 2 T threonine 5.3 18 1 V valine 5.3 18 2 W tryptophan 0.3 1 1 Y tyrosine 0.9 3 1 |
Comparative genomics:
Search single species RefSeq proteins at NCBI
Search summary 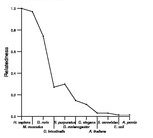
Figure data | ||
Related human proteins:Protein Relative score Description Self-match 1.000 transcription factor AP-4 (activating enhancer bindin... MNT 0.047 MAX binding protein ZNF853 0.044 zinc finger protein 853 MLXIPL 0.042 Williams Beuren syndrome chromosome region 14 isofor... MAP4K4 0.041 mitogen-activated protein kinase kinase kinase kinas... LOC283685 0.039 PREDICTED: golgi autoantigen, golgin subfamily a-li... NF2 0.039 neurofibromin 2 isoform 7 NF2 0.039 neurofibromin 2 isoform 2 NF2 0.039 neurofibromin 2 isoform 2 NF2 0.039 neurofibromin 2 isoform 7 NF2 0.039 neurofibromin 2 isoform 6 NF2 0.039 neurofibromin 2 isoform 5 NF2 0.039 neurofibromin 2 isoform 2 MLXIPL 0.039 Williams Beuren syndrome chromosome region 14 isofor... NF2 0.039 neurofibromin 2 isoform 1 TCHH 0.039 trichohyalin LOC100133758 0.038 PREDICTED: hypothetical protein, partial TWIST2 0.038 twist homolog 2 PLEC1 0.038 plectin 1 isoform 11 PLEC1 0.038 plectin 1 isoform 10 PLEC1 0.038 plectin 1 isoform 8 PLEC1 0.038 plectin 1 isoform 7 PLEC1 0.038 plectin 1 isoform 6 PLEC1 0.038 plectin 1 isoform 3 PLEC1 0.038 plectin 1 isoform 2 PLEC1 0.038 plectin 1 isoform 1 GIGYF2 0.034 GRB10 interacting GYF protein 2 isoform c GIGYF2 0.034 GRB10 interacting GYF protein 2 isoform a GIGYF2 0.034 GRB10 interacting GYF protein 2 isoform b GIGYF2 0.034 GRB10 interacting GYF protein 2 isoform bHuman BLASTP results (used to prepare the table) | |||
Gene descriptions are from NCBI RefSeq. Search results were obtained with NCBI BLAST and RefSeq entries. When identical proteins are present, the self-match may not be listed first in BLASTP output. In such cases, the table above has been reordered to place it first.
See About the Figures for the scoring system used in the figure above right. The same scoring system was used in the table of BLASTP results.
Guide to the Human Genome
Copyright © 2010 by Stewart Scherer. All rights reserved.
