
| Name: KISS1 | Sequence: fasta or formatted (138aa) | NCBI GI: 116829964 | |
|
Description: KiSS-1 metastasis-suppressor
|
Referenced in: Peptide and Protein G-coupled Signals
| ||
|
Composition:
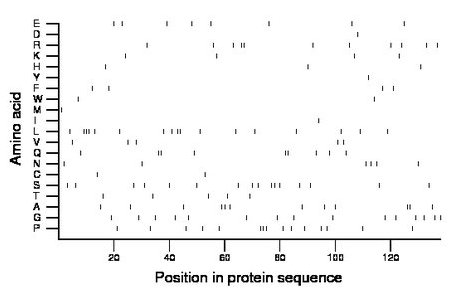
Amino acid Percentage Count Longest homopolymer A alanine 8.7 12 2 C cysteine 1.4 2 1 D aspartate 0.7 1 1 E glutamate 5.8 8 1 F phenylalanine 2.9 4 1 G glycine 10.9 15 1 H histidine 2.2 3 1 I isoleucine 0.7 1 1 K lysine 2.9 4 1 L leucine 12.3 17 3 M methionine 0.7 1 1 N asparagine 4.3 6 1 P proline 10.9 15 3 Q glutamine 6.5 9 2 R arginine 8.0 11 2 S serine 11.6 16 2 T threonine 3.6 5 1 V valine 3.6 5 1 W tryptophan 1.4 2 1 Y tyrosine 0.7 1 1 |
Comparative genomics:
Search single species RefSeq proteins at NCBI
Search summary 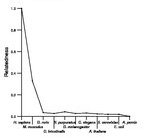
Figure data | ||
Related human proteins:Protein Relative score Description Self-match 1.000 KiSS-1 metastasis-suppressor C12orf53 0.039 hypothetical protein LOC196500 ALPK3 0.035 alpha-kinase 3 EVPL 0.035 envoplakin FLJ33544 0.031 PREDICTED: hypothetical protein FLJ33544 0.031 PREDICTED: hypothetical protein FLJ33544 0.031 PREDICTED: hypothetical protein AAK1 0.031 AP2 associated kinase 1 LOC284297 0.031 hypothetical protein LOC284297 PSRC1 0.031 proline/serine-rich coiled-coil 1 isoform a PSRC1 0.031 proline/serine-rich coiled-coil 1 isoform a PCLO 0.027 piccolo isoform 2 PCLO 0.027 piccolo isoform 1 RGL3 0.027 ral guanine nucleotide dissociation stimulator-like... NCOA6 0.027 nuclear receptor coactivator 6 CCDC86 0.027 coiled-coil domain containing 86 ULK1 0.027 Unc-51-like kinase 1 EML3 0.027 echinoderm microtubule associated protein like 3 [H... ZNF219 0.023 zinc finger protein 219 ZNF219 0.023 zinc finger protein 219 ZNF219 0.023 zinc finger protein 219 LOC100292157 0.023 PREDICTED: hypothetical protein LOC100129852 0.023 PREDICTED: hypothetical protein LOC100290926 0.023 PREDICTED: hypothetical protein XP_002347568 LOC100129852 0.023 PREDICTED: hypothetical protein LOC100288995 0.023 PREDICTED: hypothetical protein XP_002343379 LOC100129852 0.023 PREDICTED: hypothetical protein SON 0.023 SON DNA-binding protein isoform F SON 0.023 SON DNA-binding protein isoform B MUC7 0.019 mucin 7, secreted precursorHuman BLASTP results (used to prepare the table) | |||
Gene descriptions are from NCBI RefSeq. Search results were obtained with NCBI BLAST and RefSeq entries. When identical proteins are present, the self-match may not be listed first in BLASTP output. In such cases, the table above has been reordered to place it first.
See About the Figures for the scoring system used in the figure above right. The same scoring system was used in the table of BLASTP results.
Guide to the Human Genome
Copyright © 2010 by Stewart Scherer. All rights reserved.
