
| Name: FREQ | Sequence: fasta or formatted (172aa) | NCBI GI: 192447423 | |
|
Description: frequenin homolog isoform 2
|
Referenced in:
| ||
Other entries for this name:
alt prot [190aa] frequenin homolog isoform 1 | |||
|
Composition:
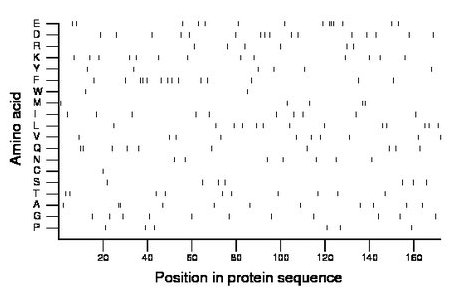
Amino acid Percentage Count Longest homopolymer A alanine 6.4 11 2 C cysteine 0.6 1 1 D aspartate 9.3 16 1 E glutamate 8.1 14 3 F phenylalanine 8.1 14 2 G glycine 6.4 11 1 H histidine 0.0 0 0 I isoleucine 5.8 10 1 K lysine 7.6 13 1 L leucine 7.6 13 1 M methionine 2.9 5 2 N asparagine 4.1 7 1 P proline 3.5 6 1 Q glutamine 5.8 10 2 R arginine 3.5 6 1 S serine 4.1 7 1 T threonine 5.8 10 1 V valine 5.8 10 1 W tryptophan 1.2 2 1 Y tyrosine 3.5 6 1 |
Comparative genomics:
Search single species RefSeq proteins at NCBI
Search summary 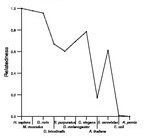
Figure data | ||
Related human proteins:Protein Relative score Description Self-match 1.000 frequenin homolog isoform 2 FREQ 0.978 frequenin homolog isoform 1 HPCAL1 0.591 hippocalcin-like 1 HPCAL1 0.591 hippocalcin-like 1 NCALD 0.585 neurocalcin delta NCALD 0.585 neurocalcin delta NCALD 0.585 neurocalcin delta NCALD 0.585 neurocalcin delta NCALD 0.585 neurocalcin delta NCALD 0.585 neurocalcin delta NCALD 0.585 neurocalcin delta NCALD 0.585 neurocalcin delta HPCA 0.578 hippocalcin VSNL1 0.545 visinin-like 1 HPCAL4 0.526 hippocalcin-like protein 4 KCNIP2 0.449 Kv channel interacting protein 2 isoform 5 KCNIP2 0.449 Kv channel interacting protein 2 isoform 6 KCNIP2 0.449 Kv channel interacting protein 2 isoform 3 KCNIP2 0.449 Kv channel interacting protein 2 isoform 1 KCNIP2 0.449 Kv channel interacting protein 2 isoform 2 KCNIP4 0.446 Kv channel interacting protein 4 isoform 3 KCNIP4 0.446 Kv channel interacting protein 4 isoform 5 KCNIP4 0.446 Kv channel interacting protein 4 isoform 4 KCNIP4 0.446 Kv channel interacting protein 4 isoform 3 KCNIP4 0.446 Kv channel interacting protein 4 isoform 2 KCNIP4 0.446 Kv channel interacting protein 4 isoform 1 KCNIP1 0.437 Kv channel interacting protein 1 isoform 3 KCNIP1 0.437 Kv channel interacting protein 1 isoform 1 KCNIP1 0.437 Kv channel interacting protein 1 isoform 2 KCNIP2 0.434 Kv channel interacting protein 2 isoform 4Human BLASTP results (used to prepare the table) | |||
Gene descriptions are from NCBI RefSeq. Search results were obtained with NCBI BLAST and RefSeq entries. When identical proteins are present, the self-match may not be listed first in BLASTP output. In such cases, the table above has been reordered to place it first.
See About the Figures for the scoring system used in the figure above right. The same scoring system was used in the table of BLASTP results.
Guide to the Human Genome
Copyright © 2010 by Stewart Scherer. All rights reserved.
