
| Name: PLAG1 | Sequence: fasta or formatted (418aa) | NCBI GI: 167857798 | |
|
Description: pleiomorphic adenoma gene 1 isoform b
|
Referenced in: Lacrimal and Salivary Glands
| ||
Other entries for this name:
alt prot [500aa] pleiomorphic adenoma gene 1 isoform a alt prot [500aa] pleiomorphic adenoma gene 1 isoform a | |||
|
Composition:
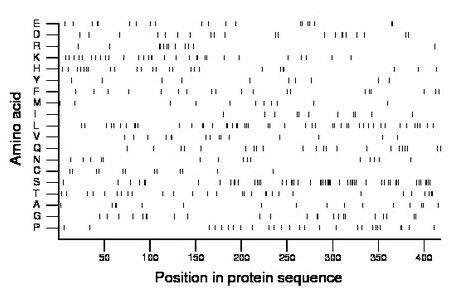
Amino acid Percentage Count Longest homopolymer A alanine 3.8 16 2 C cysteine 2.9 12 1 D aspartate 5.0 21 2 E glutamate 4.8 20 2 F phenylalanine 4.5 19 1 G glycine 5.5 23 2 H histidine 6.0 25 2 I isoleucine 2.6 11 1 K lysine 7.2 30 2 L leucine 11.2 47 2 M methionine 2.6 11 1 N asparagine 3.6 15 1 P proline 6.5 27 2 Q glutamine 5.3 22 1 R arginine 2.9 12 2 S serine 12.7 53 4 T threonine 6.9 29 2 V valine 3.6 15 2 W tryptophan 0.0 0 0 Y tyrosine 2.4 10 1 |
Comparative genomics:
Search single species RefSeq proteins at NCBI
Search summary 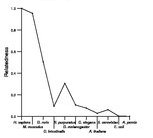
Figure data | ||
Related human proteins:Protein Relative score Description Self-match 1.000 pleiomorphic adenoma gene 1 isoform b PLAG1 1.000 pleiomorphic adenoma gene 1 isoform a PLAG1 1.000 pleiomorphic adenoma gene 1 isoform a PLAGL2 0.511 pleiomorphic adenoma gene-like 2 PLAGL1 0.327 pleiomorphic adenoma gene-like 1 isoform 1 PLAGL1 0.327 pleiomorphic adenoma gene-like 1 isoform 1 PLAGL1 0.327 pleiomorphic adenoma gene-like 1 isoform 2 PLAGL1 0.327 pleiomorphic adenoma gene-like 1 isoform 2 PLAGL1 0.327 pleiomorphic adenoma gene-like 1 isoform 2 PLAGL1 0.327 pleiomorphic adenoma gene-like 1 isoform 2 PLAGL1 0.327 pleiomorphic adenoma gene-like 1 isoform 2 PLAGL1 0.327 pleiomorphic adenoma gene-like 1 isoform 1 ZNF510 0.098 zinc finger protein 510 ZNF845 0.098 zinc finger protein 845 ZNF761 0.096 zinc finger protein 761 ZNF28 0.096 zinc finger protein 28 ZNF429 0.095 zinc finger protein 429 ZNF98 0.095 zinc finger protein 98 ZNF347 0.095 zinc finger protein 347 ZNF436 0.093 zinc finger protein 436 ZNF436 0.093 zinc finger protein 436 ZBTB17 0.093 zinc finger and BTB domain containing 17 ZNF184 0.093 zinc finger protein 184 ZNF121 0.092 zinc finger protein 121 ZNF492 0.092 zinc finger protein 492 ZNF610 0.092 zinc finger protein 610 isoform b ZNF610 0.092 zinc finger protein 610 isoform a ZNF610 0.092 zinc finger protein 610 isoform a ZNF610 0.092 zinc finger protein 610 isoform a ZNF519 0.092 zinc finger protein 519Human BLASTP results (used to prepare the table) | |||
Gene descriptions are from NCBI RefSeq. Search results were obtained with NCBI BLAST and RefSeq entries. When identical proteins are present, the self-match may not be listed first in BLASTP output. In such cases, the table above has been reordered to place it first.
See About the Figures for the scoring system used in the figure above right. The same scoring system was used in the table of BLASTP results.
Guide to the Human Genome
Copyright © 2010 by Stewart Scherer. All rights reserved.
