
| Name: TAS2R5 | Sequence: fasta or formatted (299aa) | NCBI GI: 9507173 | |
|
Description: taste receptor T2R5
|
Referenced in:
| ||
|
Composition:
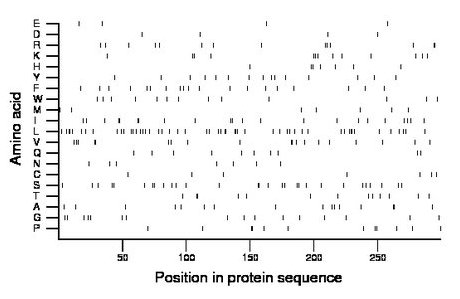
Amino acid Percentage Count Longest homopolymer A alanine 5.4 16 2 C cysteine 2.3 7 1 D aspartate 1.3 4 1 E glutamate 1.3 4 1 F phenylalanine 6.4 19 1 G glycine 5.4 16 1 H histidine 2.3 7 2 I isoleucine 7.4 22 2 K lysine 4.3 13 2 L leucine 17.4 52 3 M methionine 2.3 7 1 N asparagine 2.3 7 1 P proline 4.0 12 2 Q glutamine 3.3 10 1 R arginine 4.7 14 2 S serine 9.7 29 2 T threonine 4.3 13 2 V valine 6.4 19 2 W tryptophan 4.3 13 1 Y tyrosine 5.0 15 1 |
Comparative genomics:
Search single species RefSeq proteins at NCBI
Search summary 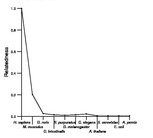
Figure data | ||
Related human proteins:Protein Relative score Description Self-match 1.000 taste receptor T2R5 TAS2R7 0.217 taste receptor, type 2, member 7 TAS2R9 0.195 taste receptor, type 2, member 9 TAS2R10 0.192 taste receptor, type 2, member 10 TAS2R13 0.185 taste receptor, type 2, member 13 TAS2R20 0.182 taste receptor, type 2, member 20 TAS2R46 0.171 taste receptor, type 2, member 46 TAS2R40 0.163 taste receptor, type 2, member 40 TAS2R3 0.163 taste receptor T2R3 TAS2R43 0.161 taste receptor, type 2, member 43 TAS2R8 0.160 taste receptor, type 2, member 8 TAS2R30 0.158 type 2 taste receptor member 30 TAS2R1 0.156 taste receptor T2R1 TAS2R19 0.156 taste receptor, type 2, member 19 TAS2R39 0.154 taste receptor, type 2, member 39 TAS2R50 0.151 taste receptor, type 2, member 50 TAS2R38 0.151 taste receptor, type 2, member 38 TAS2R45 0.148 taste receptor, type 2, member 45 TAS2R31 0.146 taste receptor, type 2, member 31 TAS2R60 0.144 taste receptor, type 2, member 60 TAS2R16 0.143 taste receptor T2R16 TAS2R14 0.143 taste receptor, type 2, member 14 TAS2R4 0.129 taste receptor T2R4 TAS2R42 0.129 taste receptor, type 2, member 42 TAS2R41 0.126 taste receptor, type 2, member 41 NIACR2 0.017 G protein-coupled receptor 109B PRLHR 0.017 G protein-coupled receptor 10 NIACR1 0.014 G protein-coupled receptor 109A ZMYM6 0.012 zinc finger protein 258 CXCR3 0.012 chemokine (C-X-C motif) receptor 3 isoform BHuman BLASTP results (used to prepare the table) | |||
Gene descriptions are from NCBI RefSeq. Search results were obtained with NCBI BLAST and RefSeq entries. When identical proteins are present, the self-match may not be listed first in BLASTP output. In such cases, the table above has been reordered to place it first.
See About the Figures for the scoring system used in the figure above right. The same scoring system was used in the table of BLASTP results.
Guide to the Human Genome
Copyright © 2010 by Stewart Scherer. All rights reserved.
