
| Name: TAS2R9 | Sequence: fasta or formatted (312aa) | NCBI GI: 12965172 | |
|
Description: taste receptor, type 2, member 9
|
Referenced in:
| ||
|
Composition:
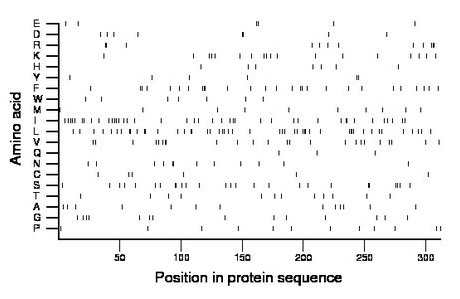
Amino acid Percentage Count Longest homopolymer A alanine 4.2 13 1 C cysteine 1.9 6 1 D aspartate 2.6 8 2 E glutamate 1.9 6 2 F phenylalanine 8.7 27 3 G glycine 4.5 14 1 H histidine 2.2 7 1 I isoleucine 13.1 41 2 K lysine 5.8 18 1 L leucine 15.4 48 4 M methionine 3.2 10 1 N asparagine 3.8 12 2 P proline 3.8 12 1 Q glutamine 1.0 3 1 R arginine 3.8 12 3 S serine 8.3 26 2 T threonine 3.8 12 1 V valine 7.7 24 2 W tryptophan 2.2 7 1 Y tyrosine 1.9 6 2 |
Comparative genomics:
Search single species RefSeq proteins at NCBI
Search summary 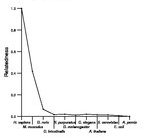
Figure data | ||
Related human proteins:Protein Relative score Description Self-match 1.000 taste receptor, type 2, member 9 TAS2R7 0.475 taste receptor, type 2, member 7 TAS2R8 0.422 taste receptor, type 2, member 8 TAS2R3 0.355 taste receptor T2R3 TAS2R10 0.340 taste receptor, type 2, member 10 TAS2R13 0.314 taste receptor, type 2, member 13 TAS2R20 0.304 taste receptor, type 2, member 20 TAS2R46 0.302 taste receptor, type 2, member 46 TAS2R30 0.299 type 2 taste receptor member 30 TAS2R31 0.287 taste receptor, type 2, member 31 TAS2R19 0.287 taste receptor, type 2, member 19 TAS2R43 0.279 taste receptor, type 2, member 43 TAS2R50 0.265 taste receptor, type 2, member 50 TAS2R45 0.265 taste receptor, type 2, member 45 TAS2R42 0.242 taste receptor, type 2, member 42 TAS2R14 0.242 taste receptor, type 2, member 14 TAS2R40 0.226 taste receptor, type 2, member 40 TAS2R41 0.220 taste receptor, type 2, member 41 TAS2R39 0.203 taste receptor, type 2, member 39 TAS2R1 0.194 taste receptor T2R1 TAS2R5 0.194 taste receptor T2R5 TAS2R60 0.184 taste receptor, type 2, member 60 TAS2R38 0.181 taste receptor, type 2, member 38 TAS2R4 0.149 taste receptor T2R4 TAS2R16 0.145 taste receptor T2R16 AGTR1 0.041 angiotensin II receptor, type 1 AGTR1 0.041 angiotensin II receptor, type 1 AGTR1 0.041 angiotensin II receptor, type 1 AGTR1 0.041 angiotensin II receptor, type 1 AGTR1 0.041 angiotensin II receptor, type 1Human BLASTP results (used to prepare the table) | |||
Gene descriptions are from NCBI RefSeq. Search results were obtained with NCBI BLAST and RefSeq entries. When identical proteins are present, the self-match may not be listed first in BLASTP output. In such cases, the table above has been reordered to place it first.
See About the Figures for the scoring system used in the figure above right. The same scoring system was used in the table of BLASTP results.
Guide to the Human Genome
Copyright © 2010 by Stewart Scherer. All rights reserved.
