
| Name: TAS2R1 | Sequence: fasta or formatted (299aa) | NCBI GI: 9625043 | |
|
Description: taste receptor T2R1
|
Referenced in:
| ||
|
Composition:
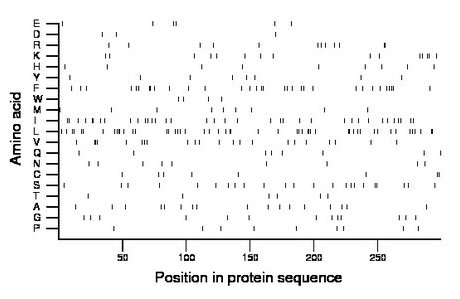
Amino acid Percentage Count Longest homopolymer A alanine 5.7 17 1 C cysteine 2.7 8 2 D aspartate 1.0 3 1 E glutamate 2.0 6 1 F phenylalanine 10.7 32 2 G glycine 4.3 13 1 H histidine 3.0 9 1 I isoleucine 12.0 36 2 K lysine 5.0 15 2 L leucine 16.7 50 3 M methionine 3.0 9 1 N asparagine 3.0 9 1 P proline 3.0 9 1 Q glutamine 2.7 8 1 R arginine 4.0 12 2 S serine 7.7 23 2 T threonine 2.0 6 1 V valine 7.4 22 3 W tryptophan 1.3 4 1 Y tyrosine 2.7 8 1 |
Comparative genomics:
Search single species RefSeq proteins at NCBI
Search summary 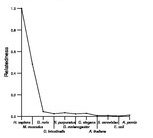
Figure data | ||
Related human proteins:Protein Relative score Description Self-match 1.000 taste receptor T2R1 TAS2R3 0.219 taste receptor T2R3 TAS2R7 0.211 taste receptor, type 2, member 7 TAS2R9 0.204 taste receptor, type 2, member 9 TAS2R40 0.202 taste receptor, type 2, member 40 TAS2R8 0.200 taste receptor, type 2, member 8 TAS2R13 0.195 taste receptor, type 2, member 13 TAS2R10 0.193 taste receptor, type 2, member 10 TAS2R39 0.189 taste receptor, type 2, member 39 TAS2R41 0.186 taste receptor, type 2, member 41 TAS2R42 0.184 taste receptor, type 2, member 42 TAS2R60 0.182 taste receptor, type 2, member 60 TAS2R38 0.175 taste receptor, type 2, member 38 TAS2R30 0.170 type 2 taste receptor member 30 TAS2R43 0.170 taste receptor, type 2, member 43 TAS2R46 0.166 taste receptor, type 2, member 46 TAS2R5 0.163 taste receptor T2R5 TAS2R20 0.163 taste receptor, type 2, member 20 TAS2R14 0.163 taste receptor, type 2, member 14 TAS2R16 0.159 taste receptor T2R16 TAS2R31 0.158 taste receptor, type 2, member 31 TAS2R19 0.158 taste receptor, type 2, member 19 TAS2R4 0.147 taste receptor T2R4 TAS2R45 0.142 taste receptor, type 2, member 45 TAS2R50 0.138 taste receptor, type 2, member 50 VN1R1 0.025 vomeronasal 1 receptor 1 FFAR3 0.023 free fatty acid receptor 3 OR6Q1 0.021 olfactory receptor, family 6, subfamily Q, member 1... SLC2A2 0.021 solute carrier family 2 (facilitated glucose transpor... OR2C1 0.021 olfactory receptor, family 2, subfamily C, member 1...Human BLASTP results (used to prepare the table) | |||
Gene descriptions are from NCBI RefSeq. Search results were obtained with NCBI BLAST and RefSeq entries. When identical proteins are present, the self-match may not be listed first in BLASTP output. In such cases, the table above has been reordered to place it first.
See About the Figures for the scoring system used in the figure above right. The same scoring system was used in the table of BLASTP results.
Guide to the Human Genome
Copyright © 2010 by Stewart Scherer. All rights reserved.
