
| Name: OXER1 | Sequence: fasta or formatted (423aa) | NCBI GI: 22507376 | |
|
Description: G-protein coupled receptor TG1019
|
Referenced in:
| ||
|
Composition:
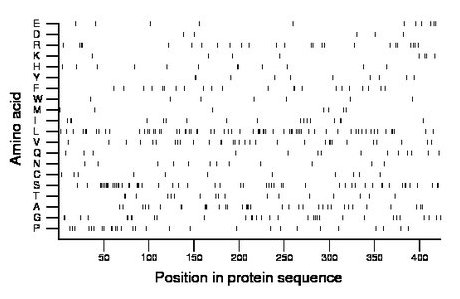
Amino acid Percentage Count Longest homopolymer A alanine 8.3 35 3 C cysteine 2.6 11 1 D aspartate 1.2 5 1 E glutamate 2.6 11 1 F phenylalanine 5.2 22 2 G glycine 7.6 32 2 H histidine 2.8 12 2 I isoleucine 4.0 17 2 K lysine 1.9 8 1 L leucine 15.6 66 3 M methionine 1.7 7 1 N asparagine 2.8 12 1 P proline 6.6 28 2 Q glutamine 3.3 14 1 R arginine 5.9 25 2 S serine 12.5 53 3 T threonine 4.0 17 2 V valine 7.3 31 2 W tryptophan 1.7 7 1 Y tyrosine 2.4 10 2 |
Comparative genomics:
Search single species RefSeq proteins at NCBI
Search summary 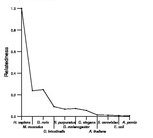
Figure data | ||
Related human proteins:Protein Relative score Description Self-match 1.000 G-protein coupled receptor TG1019 NIACR2 0.243 G protein-coupled receptor 109B NIACR1 0.230 G protein-coupled receptor 109A GPR81 0.217 G protein-coupled receptor 81 GPR31 0.172 G protein-coupled receptor 31 OPRD1 0.112 opioid receptor, delta 1 CYSLTR2 0.110 cysteinyl leukotriene receptor 2 P2RY4 0.110 pyrimidinergic receptor P2Y4 P2RY2 0.107 purinergic receptor P2Y2 P2RY2 0.107 purinergic receptor P2Y2 P2RY2 0.107 purinergic receptor P2Y2 P2RY1 0.106 purinergic receptor P2Y1 GPR20 0.104 G protein-coupled receptor 20 GPR17 0.101 G protein-coupled receptor 17 isoform a GPR17 0.101 G protein-coupled receptor 17 isoform a GPR68 0.100 G protein-coupled receptor 68 SSTR4 0.100 somatostatin receptor 4 LPAR4 0.100 lysophosphatidic acid receptor 4 GPR17 0.098 G protein-coupled receptor 17 isoform b GPR17 0.098 G protein-coupled receptor 17 isoform b SUCNR1 0.096 succinate receptor 1 APLNR 0.094 apelin receptor SSTR2 0.093 somatostatin receptor 2 GPR35 0.091 G protein-coupled receptor 35 F2RL1 0.091 coagulation factor II (thrombin) receptor-like 1 pre... GPR4 0.091 G protein-coupled receptor 4 SSTR3 0.091 somatostatin receptor 3 OPRK1 0.091 opioid receptor, kappa 1 GPR44 0.090 G protein-coupled receptor 44 GPR183 0.090 EBV-induced G protein-coupled receptor 2Human BLASTP results (used to prepare the table) | |||
Gene descriptions are from NCBI RefSeq. Search results were obtained with NCBI BLAST and RefSeq entries. When identical proteins are present, the self-match may not be listed first in BLASTP output. In such cases, the table above has been reordered to place it first.
See About the Figures for the scoring system used in the figure above right. The same scoring system was used in the table of BLASTP results.
Guide to the Human Genome
Copyright © 2010 by Stewart Scherer. All rights reserved.
