
| Name: NAT12 | Sequence: fasta or formatted (362aa) | NCBI GI: 190341107 | |
|
Description: N-acetyltransferase 12
|
Referenced in: Additional Protein Modifications
| ||
|
Composition:
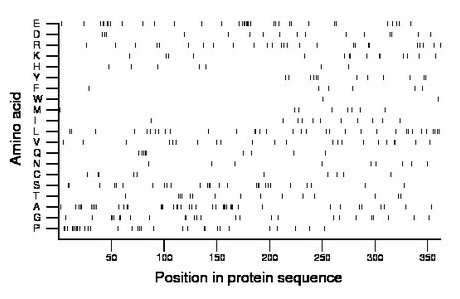
Amino acid Percentage Count Longest homopolymer A alanine 11.6 42 4 C cysteine 2.8 10 2 D aspartate 4.4 16 2 E glutamate 9.7 35 5 F phenylalanine 1.7 6 1 G glycine 7.2 26 3 H histidine 1.9 7 1 I isoleucine 3.0 11 1 K lysine 4.1 15 2 L leucine 9.4 34 2 M methionine 2.2 8 1 N asparagine 2.5 9 1 P proline 8.3 30 3 Q glutamine 2.5 9 3 R arginine 7.2 26 2 S serine 7.5 27 3 T threonine 4.1 15 2 V valine 6.1 22 2 W tryptophan 0.6 2 1 Y tyrosine 3.3 12 2 |
Comparative genomics:
Search single species RefSeq proteins at NCBI
Search summary 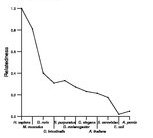
Figure data | ||
Related human proteins:Protein Relative score Description Self-match 1.000 N-acetyltransferase 12 ARD1B 0.050 alpha-N-acetyltransferase 1B ARD1A 0.048 alpha-N-acetyltransferase 1A NAT13 0.041 N-acetyltransferase 13 NACA 0.028 nascent polypeptide-associated complex alpha subuni... NAT8 0.027 N-acetyltransferase 8 GAP43 0.025 growth associated protein 43 isoform 1 GAP43 0.025 growth associated protein 43 isoform 2 RREB1 0.024 ras responsive element binding protein 1 isoform 2 [... RREB1 0.024 ras responsive element binding protein 1 isoform 1 [... WNK2 0.023 WNK lysine deficient protein kinase 2 MAPK8IP2 0.023 mitogen-activated protein kinase 8 interacting protei... MAPK8IP2 0.023 mitogen-activated protein kinase 8 interacting protei... NAT8B 0.023 N-acetyltransferase 8B NAT5 0.021 N-acetyltransferase 5 isoform a NAT5 0.021 N-acetyltransferase 5 isoform b KIAA0754 0.021 hypothetical protein LOC643314 FLJ20021 0.021 PREDICTED: hypothetical protein FLJ20021 0.021 PREDICTED: hypothetical protein FLJ20021 0.021 PREDICTED: hypothetical protein ZMIZ1 0.021 retinoic acid induced 17 SAMD1 0.021 sterile alpha motif domain containing 1 ATG2A 0.020 autophagy related 2A NAT15 0.020 N-acetyltransferase 15 NAT15 0.020 N-acetyltransferase 15 NAT15 0.020 N-acetyltransferase 15 NAT8L 0.020 N-acetyltransferase 8-like (GCN5-related, putative) ... SMTN 0.020 smoothelin isoform b SMTN 0.020 smoothelin isoform c BAT2D1 0.020 HBxAg transactivated protein 2Human BLASTP results (used to prepare the table) | |||
Gene descriptions are from NCBI RefSeq. Search results were obtained with NCBI BLAST and RefSeq entries. When identical proteins are present, the self-match may not be listed first in BLASTP output. In such cases, the table above has been reordered to place it first.
See About the Figures for the scoring system used in the figure above right. The same scoring system was used in the table of BLASTP results.
Guide to the Human Genome
Copyright © 2010 by Stewart Scherer. All rights reserved.
