
| Name: MRGPRX2 | Sequence: fasta or formatted (330aa) | NCBI GI: 16876451 | |
|
Description: MAS-related GPR, member X2
|
Referenced in: Peptide and Protein G-coupled Signals
| ||
|
Composition:
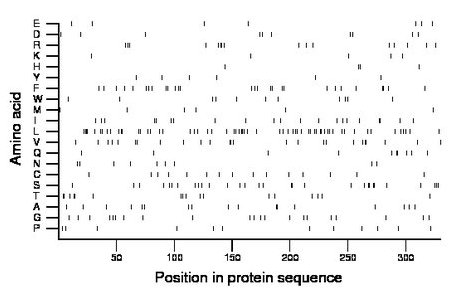
Amino acid Percentage Count Longest homopolymer A alanine 5.2 17 2 C cysteine 4.5 15 1 D aspartate 3.0 10 1 E glutamate 2.1 7 1 F phenylalanine 8.5 28 2 G glycine 6.4 21 1 H histidine 1.2 4 1 I isoleucine 6.4 21 2 K lysine 1.5 5 1 L leucine 18.2 60 4 M methionine 1.8 6 1 N asparagine 2.7 9 1 P proline 3.6 12 1 Q glutamine 3.0 10 2 R arginine 4.8 16 2 S serine 9.1 30 2 T threonine 5.2 17 2 V valine 7.6 25 2 W tryptophan 3.3 11 1 Y tyrosine 1.8 6 1 |
Comparative genomics:
Search single species RefSeq proteins at NCBI
Search summary 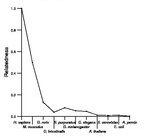
Figure data | ||
Related human proteins:Protein Relative score Description Self-match 1.000 MAS-related GPR, member X2 MRGPRX1 0.579 MAS-related GPR, member X1 MRGPRX4 0.552 MAS-related GPR, member X4 MRGPRX3 0.552 MAS-related GPR, member X3 MRGPRD 0.267 MAS-related GPR, member D MRGPRE 0.247 MAS-related GPR, member E MRGPRF 0.230 MAS-related GPR, member F MRGPRF 0.230 MAS-related GPR, member F MAS1 0.225 MAS1 oncogene MAS1L 0.202 MAS1 oncogene-like MRGPRG 0.183 PREDICTED: MAS-related GPR, member G MRGPRG 0.180 PREDICTED: MAS-related GPR, member G MRGPRG 0.180 PREDICTED: MAS-related GPR, member G CMKLR1 0.102 chemokine-like receptor 1 isoform a CMKLR1 0.102 chemokine-like receptor 1 isoform a CMKLR1 0.102 chemokine-like receptor 1 isoform a CMKLR1 0.102 chemokine-like receptor 1 isoform b FPR2 0.085 formyl peptide receptor-like 1 FPR2 0.085 formyl peptide receptor-like 1 FPR3 0.080 formyl peptide receptor-like 2 LPAR4 0.077 lysophosphatidic acid receptor 4 GPR44 0.077 G protein-coupled receptor 44 OPRK1 0.077 opioid receptor, kappa 1 GPR32 0.076 G protein-coupled receptor 32 SSTR5 0.074 somatostatin receptor 5 GPR152 0.072 G protein-coupled receptor 152 C5AR1 0.071 complement component 5 receptor 1 SSTR4 0.069 somatostatin receptor 4 GPR34 0.069 G protein-coupled receptor 34 GPR34 0.069 G protein-coupled receptor 34Human BLASTP results (used to prepare the table) | |||
Gene descriptions are from NCBI RefSeq. Search results were obtained with NCBI BLAST and RefSeq entries. When identical proteins are present, the self-match may not be listed first in BLASTP output. In such cases, the table above has been reordered to place it first.
See About the Figures for the scoring system used in the figure above right. The same scoring system was used in the table of BLASTP results.
Guide to the Human Genome
Copyright © 2010 by Stewart Scherer. All rights reserved.
