
| Name: AP2S1 | Sequence: fasta or formatted (142aa) | NCBI GI: 70906430 | |
|
Description: adaptor-related protein complex 2, sigma 1 subunit isoform AP17
|
Referenced in: ER, Golgi, and the Secretory Pathway
| ||
Other entries for this name:
alt prot [104aa] adaptor-related protein complex 2, sigma 1 subunit isoform AP17delta | |||
|
Composition:
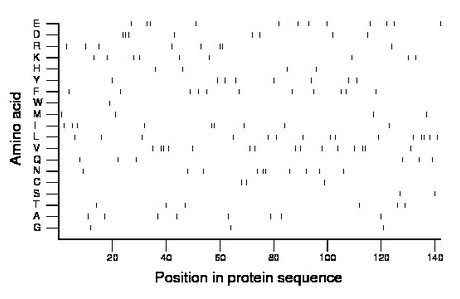
Amino acid Percentage Count Longest homopolymer A alanine 5.6 8 1 C cysteine 2.1 3 1 D aspartate 5.6 8 3 E glutamate 8.5 12 2 F phenylalanine 7.7 11 1 G glycine 2.1 3 1 H histidine 2.8 4 1 I isoleucine 6.3 9 2 K lysine 6.3 9 1 L leucine 10.6 15 2 M methionine 2.8 4 1 N asparagine 7.0 10 2 P proline 0.0 0 0 Q glutamine 4.2 6 1 R arginine 5.6 8 2 S serine 1.4 2 1 T threonine 4.2 6 1 V valine 10.6 15 2 W tryptophan 0.7 1 1 Y tyrosine 5.6 8 1 |
Comparative genomics:
Search single species RefSeq proteins at NCBI
Search summary 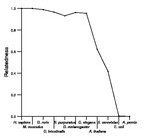
Figure data | ||
Related human proteins:Protein Relative score Description Self-match 1.000 adaptor-related protein complex 2, sigma 1 subunit i... AP2S1 0.625 adaptor-related protein complex 2, sigma 1 subunit i... AP1S1 0.451 adaptor-related protein complex 1, sigma 1 subunit [H... AP1S2 0.443 adaptor-related protein complex 1 sigma 2 subunit [H... AP1S3 0.436 adaptor-related protein complex 1, sigma 3 subunit [... AP4S1 0.371 adaptor-related protein complex 4, sigma 1 subunit ... AP3S1 0.337 adaptor-related protein complex 3, sigma 1 subunit [H... AP3S2 0.322 adaptor-related protein complex 3, sigma 2 subunit [H... AP4S1 0.261 adaptor-related protein complex 4, sigma 1 subunit i... AP1M2 0.049 adaptor-related protein complex 1, mu 2 subunit [Homo... AP2M1 0.045 adaptor-related protein complex 2, mu 1 subunit isof... AP2M1 0.045 adaptor-related protein complex 2, mu 1 subunit isof... ARCN1 0.038 archain isoform 1 TCP11L2 0.027 t-complex 11 (mouse) like 2 AP1M1 0.023 adaptor-related protein complex 1, mu 1 subunit iso... AP1M1 0.023 adaptor-related protein complex 1, mu 1 subunit isof... AP3M1 0.019 adaptor-related protein complex 3, mu 1 subunit [Homo... AP3M1 0.019 adaptor-related protein complex 3, mu 1 subunit [Hom... AP3M2 0.019 adaptor-related protein complex 3, mu 2 subunit [Ho... AP3M2 0.019 adaptor-related protein complex 3, mu 2 subunit [Homo... DZIP1 0.004 DAZ interacting protein 1 isoform 2 DZIP1 0.004 DAZ interacting protein 1 isoform 1Human BLASTP results (used to prepare the table) | |||
Gene descriptions are from NCBI RefSeq. Search results were obtained with NCBI BLAST and RefSeq entries. When identical proteins are present, the self-match may not be listed first in BLASTP output. In such cases, the table above has been reordered to place it first.
See About the Figures for the scoring system used in the figure above right. The same scoring system was used in the table of BLASTP results.
Guide to the Human Genome
Copyright © 2010 by Stewart Scherer. All rights reserved.
