
| Name: TIMM22 | Sequence: fasta or formatted (194aa) | NCBI GI: 56606061 | |
|
Description: translocase of inner mitochondrial membrane 22 homolog
|
Referenced in:
| ||
|
Composition:
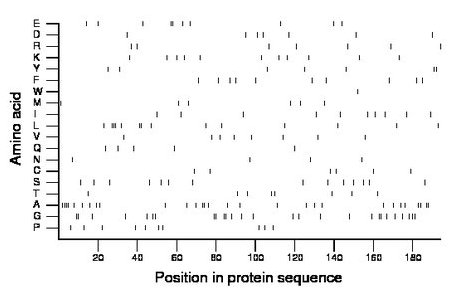
Amino acid Percentage Count Longest homopolymer A alanine 14.9 29 4 C cysteine 3.1 6 1 D aspartate 3.6 7 1 E glutamate 5.2 10 2 F phenylalanine 5.2 10 1 G glycine 13.9 27 2 H histidine 0.0 0 0 I isoleucine 5.2 10 1 K lysine 5.7 11 1 L leucine 7.2 14 3 M methionine 3.1 6 1 N asparagine 2.1 4 1 P proline 5.2 10 1 Q glutamine 2.6 5 1 R arginine 3.6 7 1 S serine 7.2 14 1 T threonine 4.1 8 1 V valine 4.1 8 1 W tryptophan 0.5 1 1 Y tyrosine 3.6 7 2 |
Comparative genomics:
Search single species RefSeq proteins at NCBI
Search summary 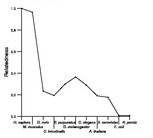
Figure data | ||
Related human proteins:Protein Relative score Description Self-match 1.000 translocase of inner mitochondrial membrane 22 homol... TIMM17A 0.054 translocase of inner mitochondrial membrane 17 homolo... TIMM17B 0.046 translocase of inner mitochondrial membrane 17 homolo... TIMM23 0.035 translocase of inner mitochondrial membrane 23 (yeast... LOC100287932 0.035 PREDICTED: hypothetical protein XP_002343027 isofor... DIDO1 0.019 death inducer-obliterator 1 isoform c ARID1A 0.016 AT rich interactive domain 1A isoform a ARID1A 0.016 AT rich interactive domain 1A isoform b USP42 0.016 ubiquitin specific peptidase 42 LOC100287932 0.011 PREDICTED: hypothetical protein XP_002343028 isofor... RLTPR 0.011 RGD motif, leucine rich repeats, tropomodulin domain... LOR 0.011 loricrin TLX1 0.011 T-cell leukemia homeobox 1 PTAR1 0.008 protein prenyltransferase alpha subunit repeat cont... PIK3R4 0.008 phosphoinositide-3-kinase, regulatory subunit 4 [Hom... NDUFA11 0.008 NADH dehydrogenase (ubiquinone) 1 alpha subcomplex, ... DCTN1 0.005 dynactin 1 isoform 4 DCTN1 0.005 dynactin 1 isoform 3 DCTN1 0.005 dynactin 1 isoform 2 DCTN1 0.005 dynactin 1 isoform 1Human BLASTP results (used to prepare the table) | |||
Gene descriptions are from NCBI RefSeq. Search results were obtained with NCBI BLAST and RefSeq entries. When identical proteins are present, the self-match may not be listed first in BLASTP output. In such cases, the table above has been reordered to place it first.
See About the Figures for the scoring system used in the figure above right. The same scoring system was used in the table of BLASTP results.
Guide to the Human Genome
Copyright © 2010 by Stewart Scherer. All rights reserved.
