
| Name: NMUR2 | Sequence: fasta or formatted (415aa) | NCBI GI: 170932505 | |
|
Description: neuromedin U receptor 2
|
Referenced in: Peptide and Protein G-coupled Signals
| ||
|
Composition:
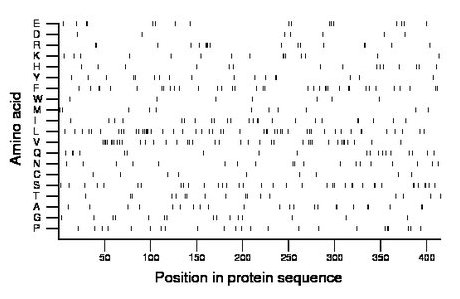
Amino acid Percentage Count Longest homopolymer A alanine 5.5 23 2 C cysteine 2.2 9 1 D aspartate 1.7 7 1 E glutamate 4.1 17 2 F phenylalanine 8.7 36 2 G glycine 3.6 15 1 H histidine 3.6 15 1 I isoleucine 5.8 24 2 K lysine 3.6 15 2 L leucine 11.8 49 3 M methionine 2.7 11 1 N asparagine 4.6 19 1 P proline 5.5 23 2 Q glutamine 4.6 19 2 R arginine 4.1 17 3 S serine 8.9 37 2 T threonine 4.1 17 2 V valine 9.2 38 2 W tryptophan 1.7 7 1 Y tyrosine 4.1 17 2 |
Comparative genomics:
Search single species RefSeq proteins at NCBI
Search summary 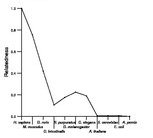
Figure data | ||
Related human proteins:Protein Relative score Description Self-match 1.000 neuromedin U receptor 2 NMUR1 0.411 neuromedin U receptor 1 MLNR 0.183 motilin receptor NTSR1 0.182 neurotensin receptor 1 GHSR 0.174 growth hormone secretagogue receptor isoform 1a [Hom... TRHR 0.143 thyrotropin-releasing hormone receptor SSTR2 0.135 somatostatin receptor 2 GPR39 0.132 G protein-coupled receptor 39 BRS3 0.130 bombesin-like receptor 3 OPRM1 0.128 opioid receptor, mu 1 isoform MOR-1H OPRM1 0.128 opioid receptor, mu 1 isoform MOR-1 OPRM1 0.128 opioid receptor, mu 1 isoform MOR-1B5 OPRM1 0.128 opioid receptor, mu 1 isoform MOR-1B2 OPRM1 0.128 opioid receptor, mu 1 isoform MOR-1B3 OPRM1 0.128 opioid receptor, mu 1 isoform MOR-1B1 OPRM1 0.128 opioid receptor, mu 1 isoform MOR-1A OPRM1 0.128 opioid receptor, mu 1 isoform MOR-1B4 OPRM1 0.128 opioid receptor, mu 1 isoform MOR-1O OPRM1 0.128 opioid receptor, mu 1 isoform MOR-1X SSTR1 0.127 somatostatin receptor 1 OPRK1 0.124 opioid receptor, kappa 1 SSTR4 0.124 somatostatin receptor 4 TACR2 0.121 tachykinin receptor 2 TACR3 0.120 tachykinin receptor 3 OPRL1 0.120 opiate receptor-like 1 OPRL1 0.120 opiate receptor-like 1 GALR2 0.120 galanin receptor 2 SSTR3 0.117 somatostatin receptor 3 QRFPR 0.116 G protein-coupled receptor 103 SSTR5 0.116 somatostatin receptor 5Human BLASTP results (used to prepare the table) | |||
Gene descriptions are from NCBI RefSeq. Search results were obtained with NCBI BLAST and RefSeq entries. When identical proteins are present, the self-match may not be listed first in BLASTP output. In such cases, the table above has been reordered to place it first.
See About the Figures for the scoring system used in the figure above right. The same scoring system was used in the table of BLASTP results.
Guide to the Human Genome
Copyright © 2010 by Stewart Scherer. All rights reserved.
