
| Name: FFAR3 | Sequence: fasta or formatted (346aa) | NCBI GI: 4885329 | |
|
Description: free fatty acid receptor 3
|
Referenced in:
| ||
|
Composition:
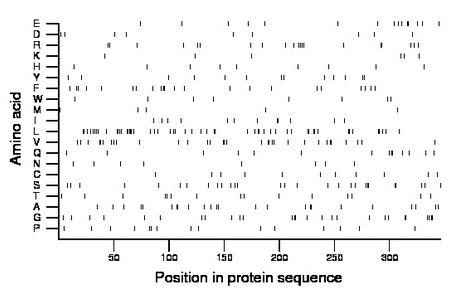
Amino acid Percentage Count Longest homopolymer A alanine 6.9 24 2 C cysteine 3.2 11 1 D aspartate 2.6 9 1 E glutamate 4.3 15 2 F phenylalanine 6.4 22 2 G glycine 7.8 27 2 H histidine 2.6 9 1 I isoleucine 3.5 12 2 K lysine 1.7 6 1 L leucine 15.3 53 5 M methionine 1.4 5 1 N asparagine 2.3 8 1 P proline 4.3 15 1 Q glutamine 4.0 14 2 R arginine 5.8 20 2 S serine 8.1 28 3 T threonine 4.3 15 2 V valine 9.2 32 2 W tryptophan 2.3 8 1 Y tyrosine 3.8 13 2 |
Comparative genomics:
Search single species RefSeq proteins at NCBI
Search summary 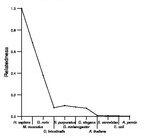
Figure data | ||
Related human proteins:Protein Relative score Description Self-match 1.000 free fatty acid receptor 3 FFAR2 0.327 free fatty acid receptor 2 FFAR1 0.159 free fatty acid receptor 1 P2RY8 0.153 G-protein coupled purinergic receptor P2Y8 F2R 0.148 coagulation factor II receptor precursor LPAR5 0.148 lysophosphatidic acid receptor 5 LPAR5 0.148 lysophosphatidic acid receptor 5 F2RL1 0.147 coagulation factor II (thrombin) receptor-like 1 pre... LPAR4 0.141 lysophosphatidic acid receptor 4 GPR183 0.135 EBV-induced G protein-coupled receptor 2 GPR17 0.134 G protein-coupled receptor 17 isoform b GPR17 0.134 G protein-coupled receptor 17 isoform b GPR17 0.134 G protein-coupled receptor 17 isoform a GPR17 0.134 G protein-coupled receptor 17 isoform a F2RL2 0.126 coagulation factor II (thrombin) receptor-like 2 prec... F2RL3 0.126 coagulation factor II (thrombin) receptor-like 3 pre... LPAR6 0.125 G-protein coupled purinergic receptor P2Y5 LPAR6 0.125 G-protein coupled purinergic receptor P2Y5 LPAR6 0.125 G-protein coupled purinergic receptor P2Y5 P2RY4 0.122 pyrimidinergic receptor P2Y4 P2RY6 0.120 pyrimidinergic receptor P2Y6 P2RY6 0.120 pyrimidinergic receptor P2Y6 P2RY6 0.120 pyrimidinergic receptor P2Y6 P2RY6 0.120 pyrimidinergic receptor P2Y6 APLNR 0.119 apelin receptor GPR34 0.116 G protein-coupled receptor 34 GPR34 0.116 G protein-coupled receptor 34 SSTR3 0.115 somatostatin receptor 3 GPR1 0.115 G protein-coupled receptor 1 GPR1 0.115 G protein-coupled receptor 1Human BLASTP results (used to prepare the table) | |||
Gene descriptions are from NCBI RefSeq. Search results were obtained with NCBI BLAST and RefSeq entries. When identical proteins are present, the self-match may not be listed first in BLASTP output. In such cases, the table above has been reordered to place it first.
See About the Figures for the scoring system used in the figure above right. The same scoring system was used in the table of BLASTP results.
Guide to the Human Genome
Copyright © 2010 by Stewart Scherer. All rights reserved.
