
| Name: PGDS | Sequence: fasta or formatted (199aa) | NCBI GI: 7657457 | |
|
Description: prostaglandin-D synthase
|
Referenced in: Arachidonate, Prostaglandins, and Leukotrienes
| ||
|
Composition:
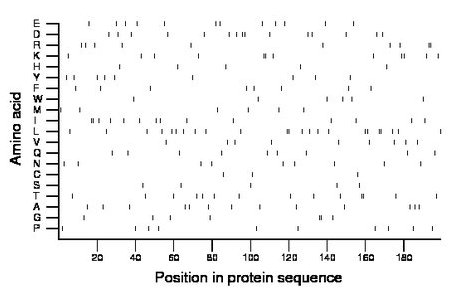
Amino acid Percentage Count Longest homopolymer A alanine 6.5 13 1 C cysteine 1.5 3 1 D aspartate 7.5 15 2 E glutamate 6.0 12 1 F phenylalanine 4.0 8 1 G glycine 3.5 7 2 H histidine 2.5 5 1 I isoleucine 7.0 14 2 K lysine 6.0 12 2 L leucine 11.6 23 2 M methionine 3.0 6 1 N asparagine 4.5 9 1 P proline 5.0 10 1 Q glutamine 4.5 9 1 R arginine 5.0 10 2 S serine 2.5 5 1 T threonine 7.0 14 2 V valine 4.5 9 1 W tryptophan 3.0 6 1 Y tyrosine 4.5 9 1 |
Comparative genomics:
Search single species RefSeq proteins at NCBI
Search summary 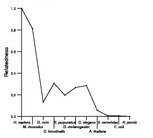
Figure data | ||
Related human proteins:Protein Relative score Description Self-match 1.000 prostaglandin-D synthase GSTM4 0.128 glutathione S-transferase mu 4 isoform 1 GSTM3 0.125 glutathione S-transferase mu 3 GSTM1 0.122 glutathione S-transferase mu 1 isoform 1 GSTM4 0.122 glutathione S-transferase mu 4 isoform 2 GSTM2 0.120 glutathione S-transferase mu 2 isoform 1 GSTA2 0.117 glutathione S-transferase alpha 2 GSTA5 0.115 glutathione S-transferase alpha 5 GSTM2 0.112 glutathione S-transferase mu 2 isoform 2 GSTA1 0.112 glutathione S-transferase alpha 1 GSTA3 0.110 glutathione S-transferase alpha 3 GSTM5 0.102 glutathione S-transferase mu 5 GSTP1 0.094 glutathione transferase GSTA4 0.087 glutathione S-transferase alpha 4 GSTM1 0.082 glutathione S-transferase mu 1 isoform 2 LOC647169 0.041 PREDICTED: similar to glutathione S-transferase alp... LOC647169 0.036 PREDICTED: similar to glutathione S-transferase alp... LOC647169 0.036 PREDICTED: similar to glutathione S-transferase alp... EEF1G 0.036 eukaryotic translation elongation factor 1 gamma [Hom... GSTZ1 0.031 glutathione transferase zeta 1 isoform 1 GSTZ1 0.026 glutathione transferase zeta 1 isoform 3 GSTZ1 0.010 glutathione transferase zeta 1 isoform 2 NUP133 0.008 nucleoporin 133kDa KIAA1549 0.008 hypothetical protein LOC57670 CYP2U1 0.008 cytochrome P450, family 2, subfamily U, polypeptide ... LOC402160 0.005 PREDICTED: similar to hCG18094 LOC402160 0.005 PREDICTED: similar to hCG18094 LOC402160 0.005 PREDICTED: similar to hCG18094 SMC6 0.005 SMC6 protein SMC6 0.005 SMC6 proteinHuman BLASTP results (used to prepare the table) | |||
Gene descriptions are from NCBI RefSeq. Search results were obtained with NCBI BLAST and RefSeq entries. When identical proteins are present, the self-match may not be listed first in BLASTP output. In such cases, the table above has been reordered to place it first.
See About the Figures for the scoring system used in the figure above right. The same scoring system was used in the table of BLASTP results.
Guide to the Human Genome
Copyright © 2010 by Stewart Scherer. All rights reserved.
