
| Name: PIGG | Sequence: fasta or formatted (983aa) | NCBI GI: 187608446 | |
|
Description: phosphatidylinositol glycan anchor biosynthesis, class G isoform 1
|
Referenced in:
| ||
Other entries for this name:
alt prot [975aa] phosphatidylinositol glycan anchor biosynthesis, class G isoform 2 | |||
|
Composition:
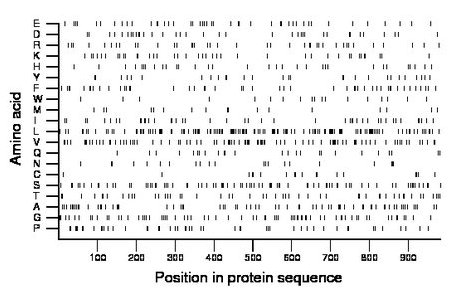
Amino acid Percentage Count Longest homopolymer A alanine 7.5 74 2 C cysteine 1.9 19 2 D aspartate 3.9 38 2 E glutamate 4.8 47 3 F phenylalanine 5.0 49 2 G glycine 7.0 69 2 H histidine 3.3 32 1 I isoleucine 4.5 44 2 K lysine 4.0 39 1 L leucine 14.1 139 4 M methionine 1.8 18 2 N asparagine 2.2 22 2 P proline 5.2 51 3 Q glutamine 2.6 26 2 R arginine 4.2 41 2 S serine 8.7 86 2 T threonine 5.4 53 2 V valine 9.2 90 3 W tryptophan 1.8 18 1 Y tyrosine 2.8 28 1 |
Comparative genomics:
Search single species RefSeq proteins at NCBI
Search summary 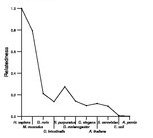
Figure data | ||
Related human proteins:Protein Relative score Description Self-match 1.000 phosphatidylinositol glycan anchor biosynthesis, cl... PIGG 0.989 phosphatidylinositol glycan anchor biosynthesis, cl... PIGO 0.093 phosphatidylinositol glycan anchor biosynthesis, cla... PIGO 0.093 phosphatidylinositol glycan anchor biosynthesis, cla... PIGN 0.020 phosphatidylinositol glycan anchor biosynthesis, clas... PIGN 0.020 phosphatidylinositol glycan anchor biosynthesis, cla... ENPP5 0.011 ectonucleotide pyrophosphatase/phosphodiesterase 5 (... ENPP6 0.010 ectonucleotide pyrophosphatase/phosphodiesterase 6 [... ENPP3 0.005 ectonucleotide pyrophosphatase/phosphodiesterase 3 ... STS 0.005 steryl-sulfatase precursor MYBPH 0.004 myosin binding protein H LOC729213 0.004 PREDICTED: similar to ectonucleotide pyrophosphatas... MAST1 0.003 microtubule associated serine/threonine kinase 1 [Ho... LPCAT1 0.003 lysophosphatidylcholine acyltransferase 1 LOC100287723 0.003 PREDICTED: hypothetical protein XP_002342271 ENPP7 0.003 ectonucleotide pyrophosphatase/phosphodiesterase 7 [... POLRMT 0.003 mitochondrial DNA-directed RNA polymerase precursor... TRPA1 0.003 ankyrin-like protein 1 MUC7 0.003 mucin 7, secreted precursor MUC7 0.003 mucin 7, secreted precursor MUC7 0.003 mucin 7, secreted precursor SHISA5 0.003 scotin FOXK1 0.003 forkhead box K1Human BLASTP results (used to prepare the table) | |||
Gene descriptions are from NCBI RefSeq. Search results were obtained with NCBI BLAST and RefSeq entries. When identical proteins are present, the self-match may not be listed first in BLASTP output. In such cases, the table above has been reordered to place it first.
See About the Figures for the scoring system used in the figure above right. The same scoring system was used in the table of BLASTP results.
Guide to the Human Genome
Copyright © 2010 by Stewart Scherer. All rights reserved.
