
| Name: GSTK1 | Sequence: fasta or formatted (226aa) | NCBI GI: 7705704 | |
|
Description: glutathione S-transferase kappa 1 isoform a
|
Referenced in:
| ||
Other entries for this name:
alt prot [282aa] glutathione S-transferase kappa 1 isoform b alt prot [214aa] glutathione S-transferase kappa 1 isoform c alt prot [183aa] glutathione S-transferase kappa 1 isoform d | |||
|
Composition:
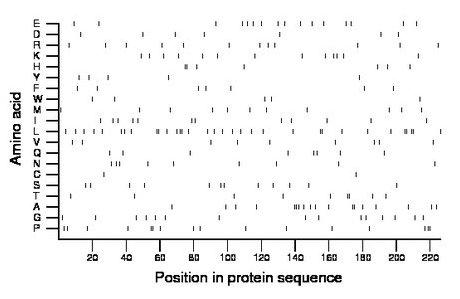
Amino acid Percentage Count Longest homopolymer A alanine 8.0 18 3 C cysteine 0.9 2 1 D aspartate 3.1 7 1 E glutamate 7.1 16 1 F phenylalanine 3.1 7 1 G glycine 6.6 15 1 H histidine 3.1 7 2 I isoleucine 5.3 12 1 K lysine 5.8 13 1 L leucine 14.6 33 2 M methionine 4.9 11 1 N asparagine 4.0 9 1 P proline 7.1 16 2 Q glutamine 3.5 8 1 R arginine 5.3 12 1 S serine 5.3 12 1 T threonine 4.0 9 2 V valine 4.0 9 1 W tryptophan 2.2 5 1 Y tyrosine 2.2 5 1 |
Comparative genomics:
Search single species RefSeq proteins at NCBI
Search summary 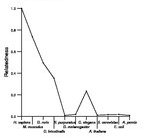
Figure data | ||
Related human proteins:Protein Relative score Description Self-match 1.000 glutathione S-transferase kappa 1 isoform a GSTK1 0.927 glutathione S-transferase kappa 1 isoform c GSTK1 0.897 glutathione S-transferase kappa 1 isoform b GSTK1 0.748 glutathione S-transferase kappa 1 isoform d RCOR1 0.016 REST corepressor 1 CT47A1 0.011 cancer/testis antigen family 47, member A1 CT47A2 0.011 cancer/testis antigen family 47, member A2 CT47A3 0.011 cancer/testis antigen family 47, member A3 CT47A4 0.011 cancer/testis antigen family 47, member A4 CT47A5 0.011 cancer/testis antigen family 47, member A5 CT47A6 0.011 cancer/testis antigen family 47, member A6 CT47A7 0.011 cancer/testis antigen family 47, member A7 CT47A8 0.011 cancer/testis antigen family 47, member A8 CT47A9 0.011 cancer/testis antigen family 47, member A9 CT47A10 0.011 cancer/testis antigen family 47, member A10 CT47A11 0.011 cancer/testis antigen family 47, member A11 KIAA0774 0.011 hypothetical protein LOC23281 isoform a C20orf74 0.009 akt substrate AS250 SERPINB12 0.007 serine (or cysteine) proteinase inhibitor, clade B (...Human BLASTP results (used to prepare the table) | |||
Gene descriptions are from NCBI RefSeq. Search results were obtained with NCBI BLAST and RefSeq entries. When identical proteins are present, the self-match may not be listed first in BLASTP output. In such cases, the table above has been reordered to place it first.
See About the Figures for the scoring system used in the figure above right. The same scoring system was used in the table of BLASTP results.
Guide to the Human Genome
Copyright © 2010 by Stewart Scherer. All rights reserved.
