
| Name: ATP5J2 | Sequence: fasta or formatted (88aa) | NCBI GI: 51479129 | |
|
Description: ATP synthase, H+ transporting, mitochondrial F0 complex, subunit F2 isoform 2b
|
Referenced in:
| ||
Other entries for this name:
alt prot [94aa] ATP synthase, H+ transporting, mitochondrial F0 complex, subunit ... alt prot [55aa] ATP synthase, H+ transporting, mitochondrial F0 complex, subunit ... alt prot [49aa] ATP synthase, H+ transporting, mitochondrial F0 complex, subunit ... | |||
|
Composition:
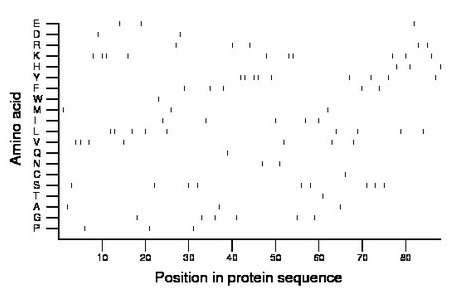
Amino acid Percentage Count Longest homopolymer A alanine 3.4 3 1 C cysteine 1.1 1 1 D aspartate 2.3 2 1 E glutamate 3.4 3 1 F phenylalanine 5.7 5 1 G glycine 6.8 6 1 H histidine 3.4 3 1 I isoleucine 5.7 5 1 K lysine 11.4 10 2 L leucine 10.2 9 2 M methionine 3.4 3 1 N asparagine 2.3 2 1 P proline 3.4 3 1 Q glutamine 1.1 1 1 R arginine 5.7 5 1 S serine 10.2 9 1 T threonine 1.1 1 1 V valine 8.0 7 2 W tryptophan 1.1 1 1 Y tyrosine 10.2 9 2 |
Comparative genomics:
Search single species RefSeq proteins at NCBI
Search summary 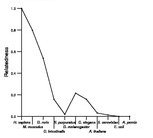
Figure data | ||
Related human proteins:Protein Relative score Description Self-match 1.000 ATP synthase, H+ transporting, mitochondrial F0 comp... ATP5J2 0.962 ATP synthase, H+ transporting, mitochondrial F0 compl... LOC645225 0.639 PREDICTED: similar to ATP synthase, H+ transporting... LOC645225 0.639 PREDICTED: similar to ATP synthase, H+ transporting,... LOC645225 0.639 PREDICTED: similar to ATP synthase, H+ transporting,... ATP5J2 0.373 ATP synthase, H+ transporting, mitochondrial F0 comp... LOC100293489 0.342 PREDICTED: similar to ATP synthase, H+ transporting... ATP5J2 0.329 ATP synthase, H+ transporting, mitochondrial F0 comp... C17orf80 0.101 lung cancer-related protein 8 isoform c C17orf80 0.076 lung cancer-related protein 8 isoform a SLC7A9 0.019 solute carrier family 7, member 9 SLC7A9 0.019 solute carrier family 7, member 9Human BLASTP results (used to prepare the table) | |||
Gene descriptions are from NCBI RefSeq. Search results were obtained with NCBI BLAST and RefSeq entries. When identical proteins are present, the self-match may not be listed first in BLASTP output. In such cases, the table above has been reordered to place it first.
See About the Figures for the scoring system used in the figure above right. The same scoring system was used in the table of BLASTP results.
Guide to the Human Genome
Copyright © 2010 by Stewart Scherer. All rights reserved.
